The Best Multi Strategy Gold Indicator for XAUUSD H4 on TradingView: AsliGold MSC (Free)
A complete walkthrough of the AsliGold Multi Strategy Confluence indicator. Five long only XAUUSD H4 strategies running together in one chart, with live dashboard, R multiple tracking, and one click alerts. Free on TradingView.
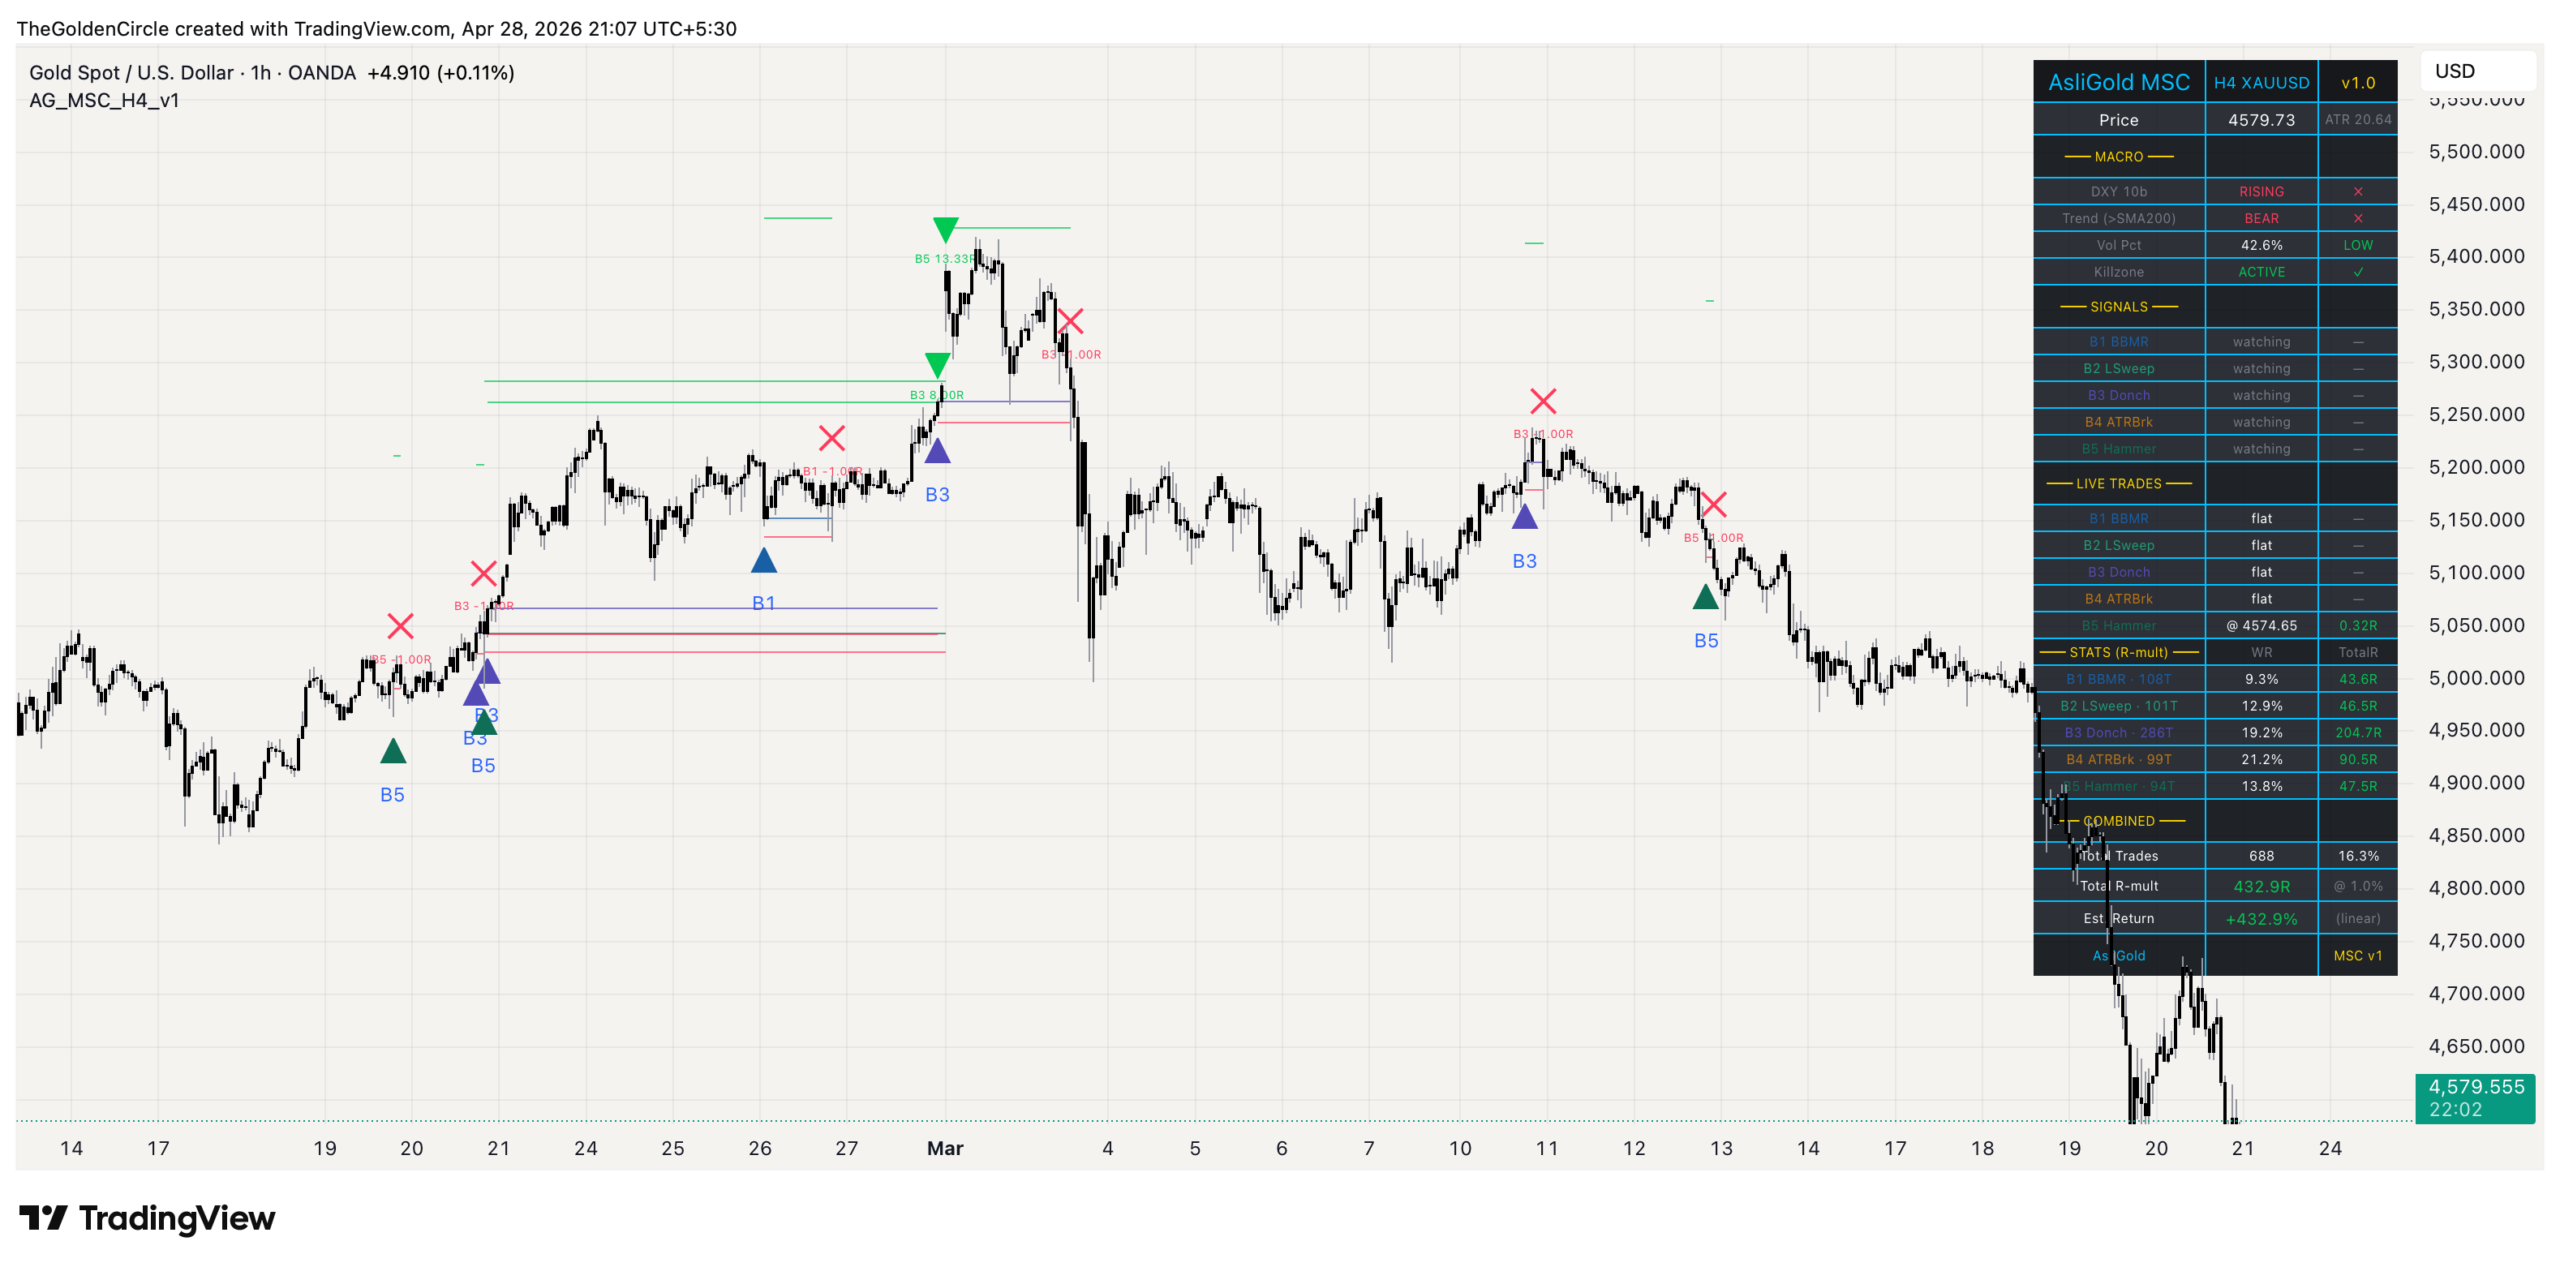
AsliGold MSC running on a live OANDA:XAUUSD H4 chart with the strategy dashboard, entry markers, and trade levels visible.
What you will find inside
- Why a multi strategy indicator beats a single edge on gold
- What the indicator actually does
- The five strategies inside MSC
- How the 5 strategies work together (interactive)
- How to read the chart
- Reading the live dashboard
- Setup on TradingView (3 steps)
- One click alert configuration
- How to size positions and manage risk
- Who this indicator is for
- Frequently asked questions
- Get the indicator
Why a multi strategy indicator beats a single edge on gold
Most gold trading indicators on TradingView focus on one specific setup. A trend follower waits for moving average crossovers. A mean reversion tool watches for Bollinger Band touches. A breakout system fires on Donchian channel breaks. Each one has a place in your toolkit, but each one also has a problem. The problem is that gold does not stay in one regime. It trends for months, then ranges for months, then sweeps stops, then breaks out hard, then chops sideways. A single edge tool stays silent during the wrong regime, and the trader either jumps to a different indicator (losing consistency) or sits on their hands waiting for a setup that may take weeks to arrive.
The AsliGold Multi Strategy Confluence indicator solves this by running five different long only strategies on the same XAUUSD H4 chart at the same time. Each strategy was selected from a much larger pool through quantitative testing, and each one targets a specific market behaviour. Because they fire in different conditions, the suite as a whole stays active across most market environments. When one strategy is silent, another is usually working.
This is not a fancy way of saying it averages five indicators together. The five strategies are independent, they each have their own entry logic, stop loss, take profit, and time exit. The indicator simply detects when each one triggers and tracks each trade separately so you can see exactly which strategy is firing and why.
What the indicator actually does
The AsliGold MSC indicator monitors XAUUSD H4 candles in real time. On every closed bar, it checks the entry conditions for all five strategies. If any of them triggers, the indicator does five things automatically.
First, it draws an entry marker on the bar with a label showing which strategy fired (B1 through B5). Second, it draws three lines: the entry price, the stop loss, and the take profit. Third, it tracks the trade through subsequent bars, extending the lines forward as the bar count grows. Fourth, when one of the exit conditions is met (stop hit, target hit, or maximum bars elapsed), it draws an exit marker and prints a small label showing the realised R multiple. Fifth, it updates the live dashboard in the top right corner with the latest signal status, active trade information, and per strategy statistics.
The indicator does not place trades for you. This is by design. You decide whether to take any given signal based on your own risk tolerance, account size, and other open positions. The indicator gives you everything you need to make that decision quickly.
The five strategies inside AsliGold MSC
Each of the five strategies inside MSC targets a different setup type. Together they cover the major categories of trading edges: pullback, sweep, breakout, momentum, and rejection. Here is what each one looks for.
| Code | Strategy name | What it looks for |
|---|---|---|
| B1 | BBMR (Bollinger Mean Reversion) | Pullback to lower Bollinger Band in a confirmed uptrend, with DXY weakness and a calm volatility regime |
| B2 | LSweep (Liquidity Sweep) | Failed breakdown of the prior 40 bar low, where price sweeps stops then closes back above the level |
| B3 | Donchian Breakout | Fresh 80 bar high break above the SMA 200 trend line, the trend following workhorse |
| B4 | ATR Breakout | Momentum burst more than 1.5 times ATR above the prior close, gated by EMA 20 slope and the 12 to 16 UTC killzone |
| B5 | Hammer Rejection | Bullish hammer rejection candle in a low volatility killzone session |
All five strategies are long only by design. Gold is structurally a momentum and trend asset, and previous research across many configurations has shown that short setups on gold do not produce consistent edge. The mean correlation between these five strategies is 0.13, which means they fire in genuinely different conditions and rarely overlap on the same bar.
A historical XAUUSD H4 segment showing entry markers from multiple strategies with their respective stop and target lines.
How the 5 strategies work together (interactive)
Every closed XAUUSD H4 candle runs through the same pipeline. Macro filters set the scene, then all five strategies evaluate in parallel. Click any strategy card below to expand its filter conditions, trade levels, and role in the suite.
How the 5 strategies work together
Click any strategy below to expand its filter conditions, trade levels, and role
How to read the chart
Once the indicator is loaded, the chart shows several visual elements. Each one has a specific meaning.
| Element | What it means |
|---|---|
| Triangle below bar with B1 to B5 label | A new long entry signal from that specific strategy on the closed bar |
| Yellow horizontal line | Entry price for an active trade |
| Red horizontal line | Stop loss for an active trade |
| Green horizontal line | Take profit for an active trade |
| Green triangle above bar | Trade exited at take profit |
| Red cross above bar | Trade exited at stop loss |
| Diamond above bar (amber or gray) | Trade exited at maximum bar limit (amber for win, gray for loss) |
| Small text label at exit (e.g. “B3 16.00R”) | Realised R multiple for that trade |
The Entry, Stop, and Target lines stay frozen at the exit bar after a trade closes, so you can scroll back through history and audit every trade visually. Nothing disappears.
Reading the live dashboard
The dashboard sits in the top right corner of the chart and contains everything you need to assess the suite at a glance. It is organised into five sections.
| Section | What it shows |
|---|---|
| Macro | Current DXY direction, gold trend regime (above or below SMA 200), volatility percentile, killzone status |
| Signals | Whether each of the 5 strategies is currently firing, watching, or disabled |
| Live Trades | For each active trade, shows entry price and current R multiple in real time |
| Stats | Per strategy trade count, win rate, and total R multiple since the chart loaded |
| Combined | Total trades across all 5 strategies, total R multiple, and estimated portfolio percent return at your chosen risk per trade |
The Combined row is especially useful because it tells you in one number what your portfolio R has been over the visible chart history. If you scroll back and load more historical bars, the dashboard updates automatically. This lets you verify on your own data whether the suite is performing as expected.
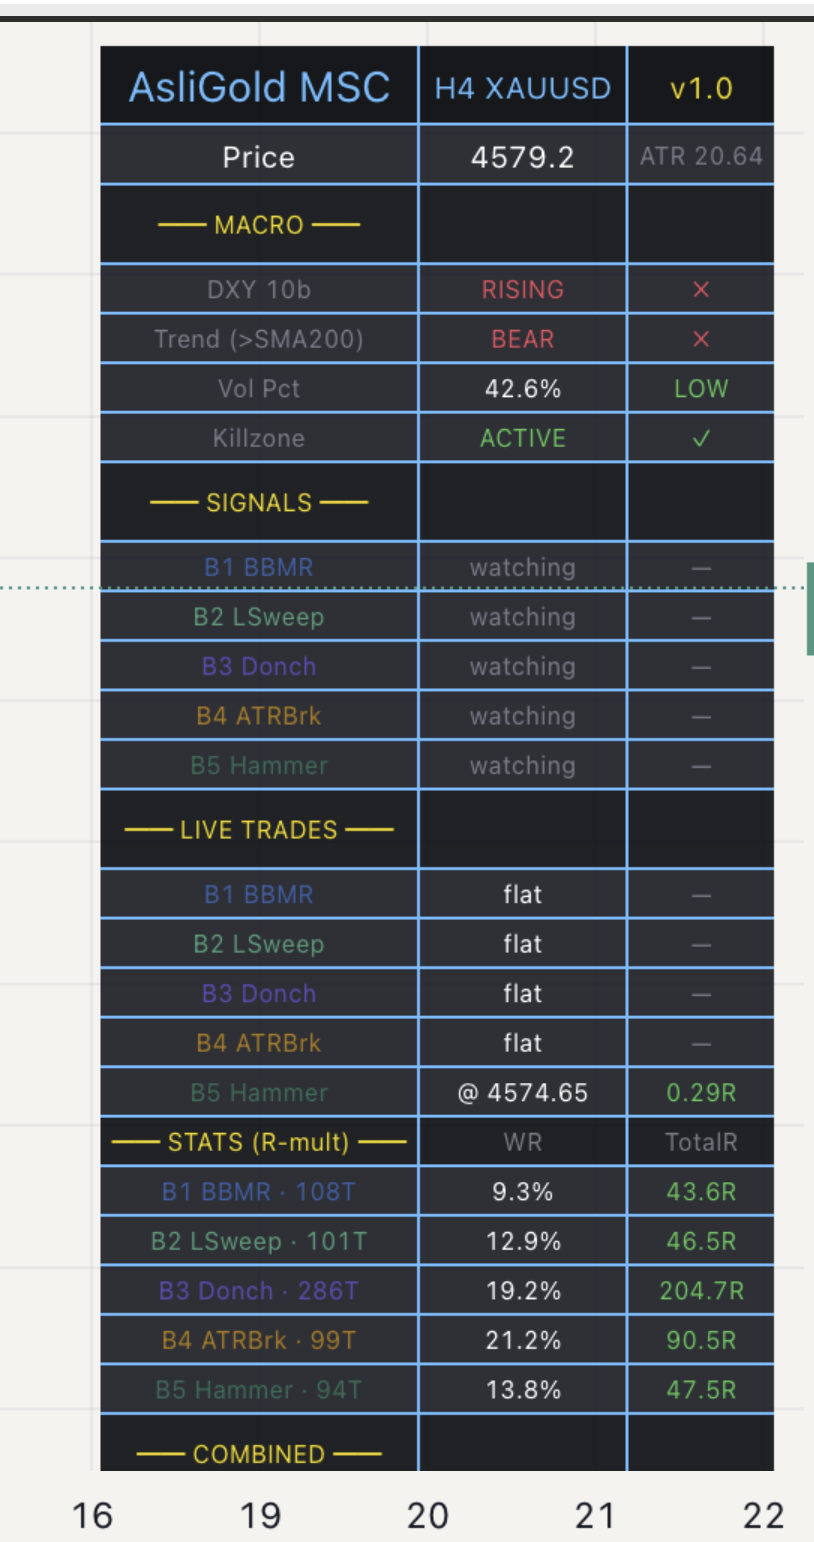
The MSC live dashboard with all five strategies enabled, showing the macro filter status, current signals, and per strategy statistics.
Setup on TradingView (3 steps)
Getting the indicator running takes less than two minutes if you already have a TradingView account.
Step 1. Open the TradingView indicator page for AsliGold MSC and click the “Add to Favorites” star icon. The indicator is published as a protected source script which means you can use it freely without limitations.
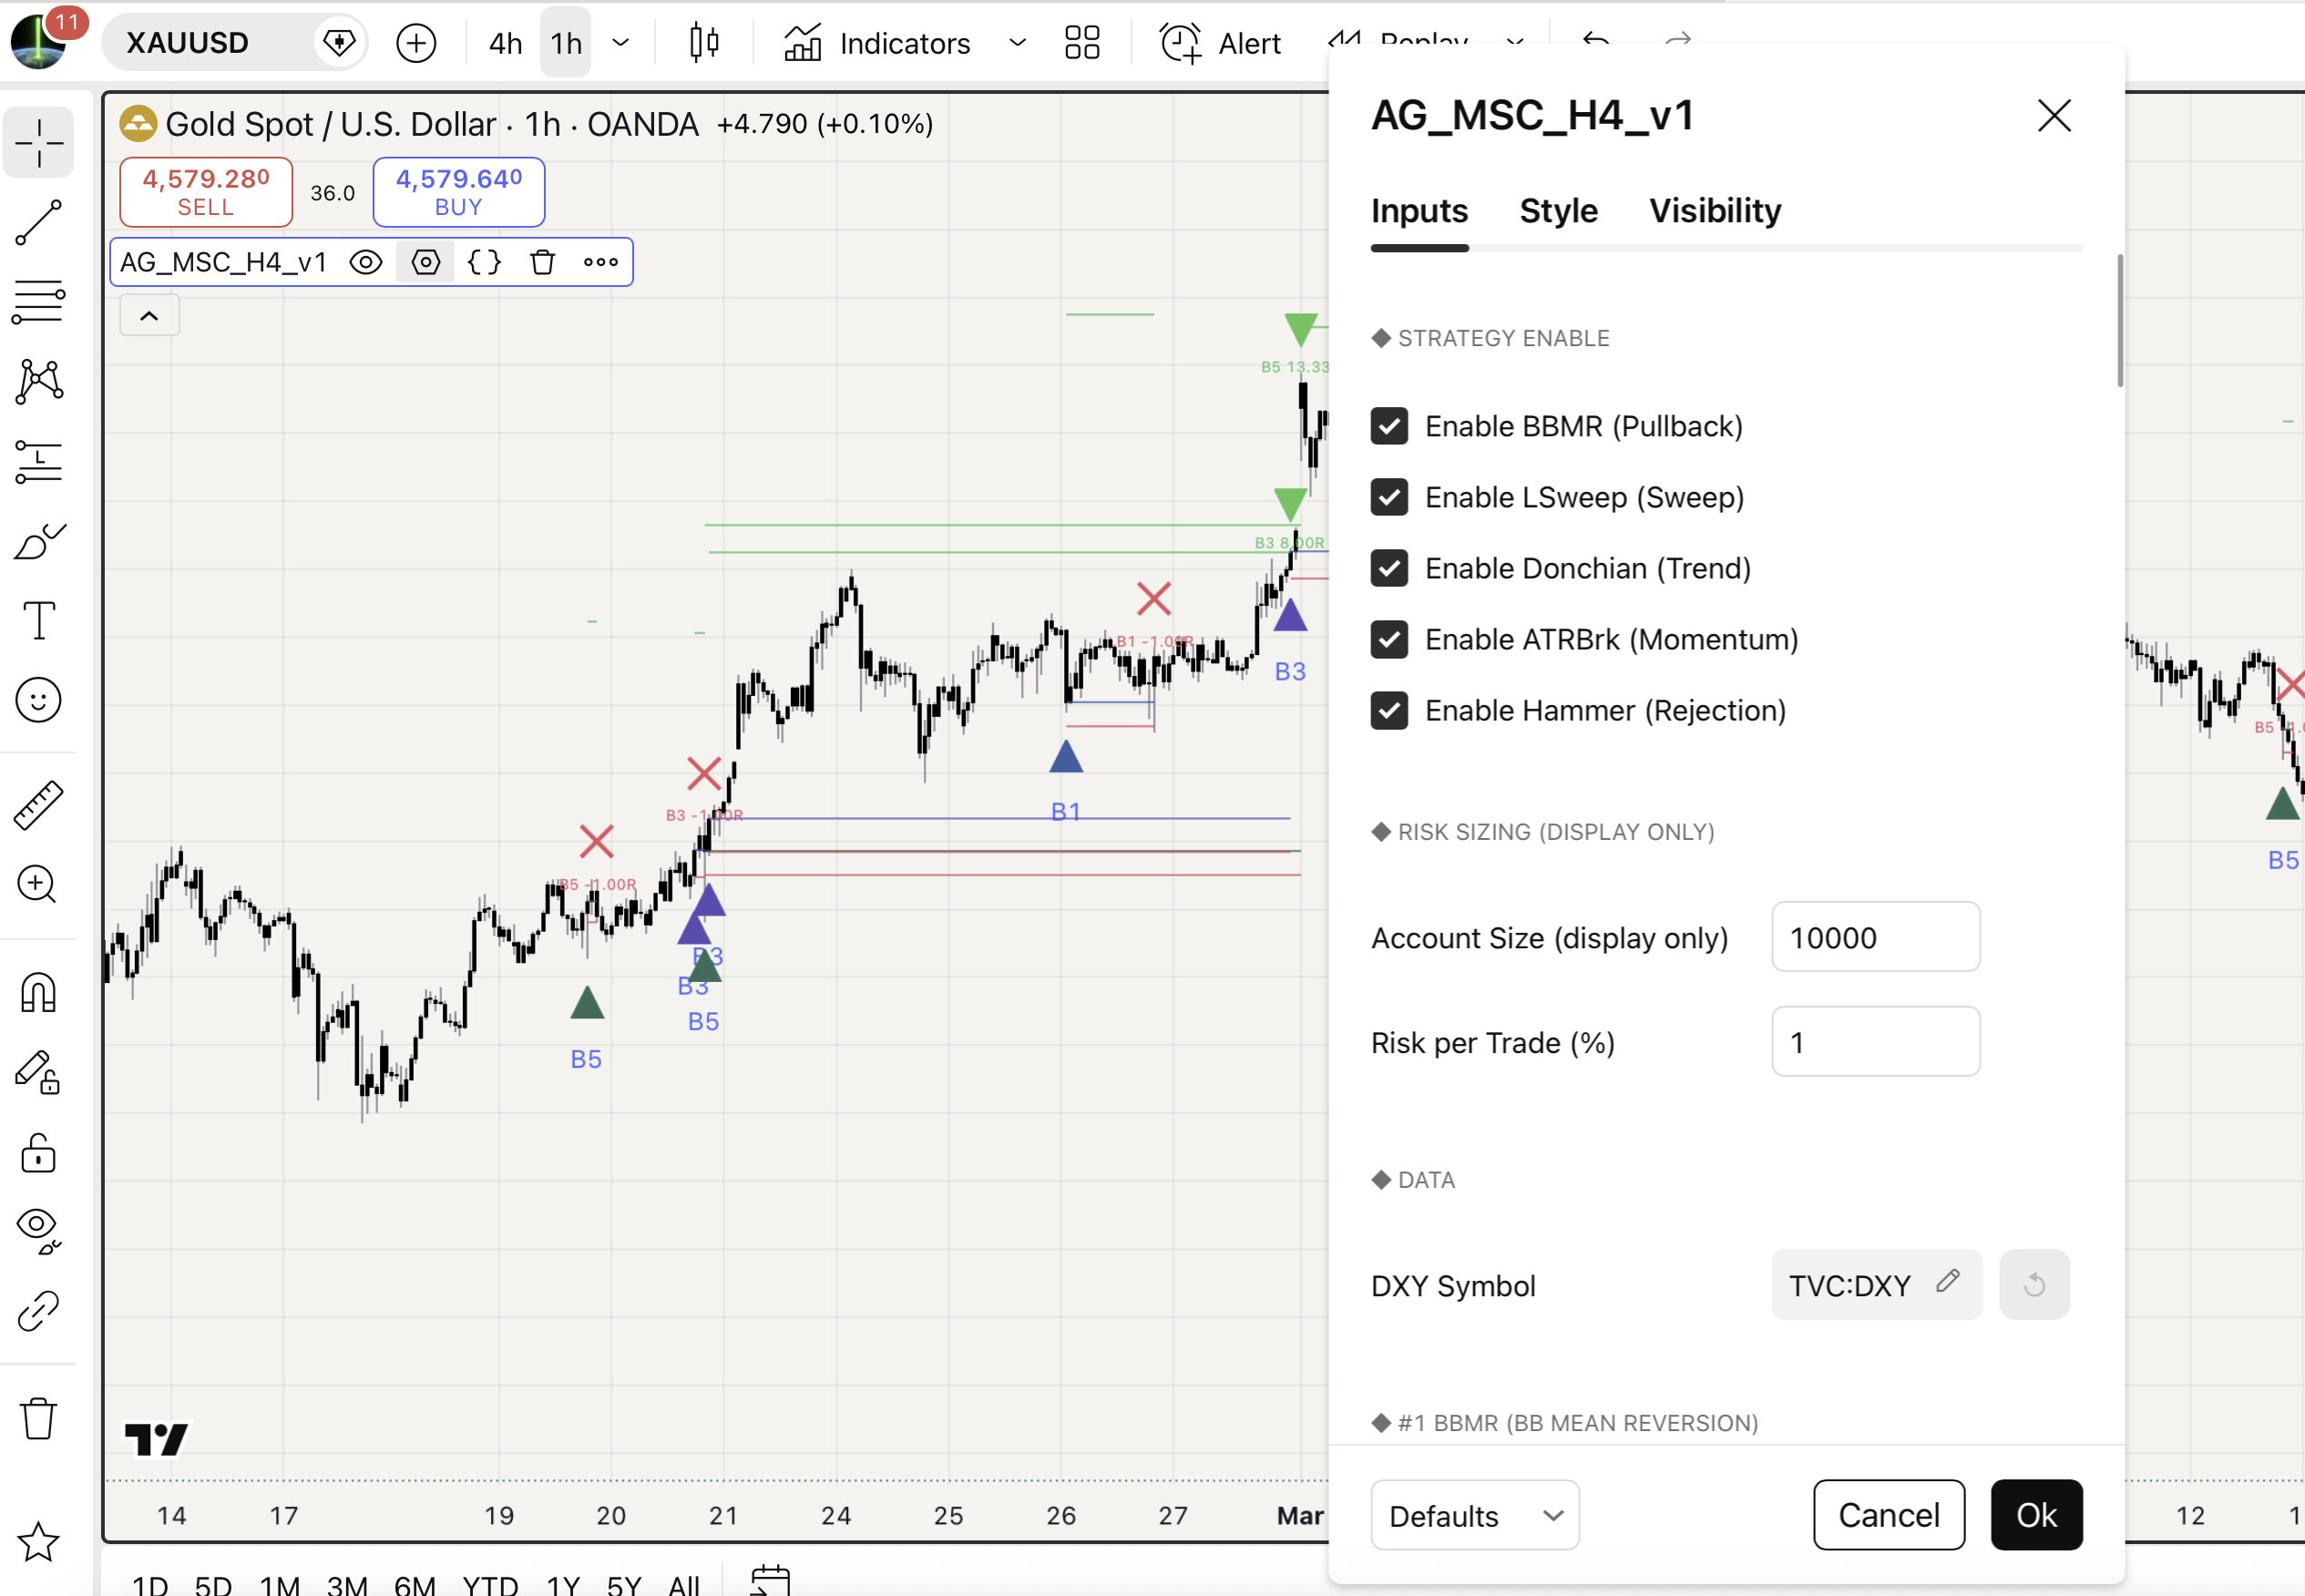
Step 2. Open a new chart, set the symbol to OANDA:XAUUSD and the timeframe to 4 hour. Click the “Indicators” button at the top of the chart, switch to the “Favorites” tab, and click on AsliGold MSC to add it.
Step 3. The indicator loads with sensible defaults. The dashboard appears in the top right corner. Historical entry and exit markers populate across the visible chart history. You are ready to use it.
If your TradingView plan does not have access to the TVC:DXY symbol, open the indicator settings, scroll to the “Data” group, and switch the DXY symbol input to one that your plan supports (such as DXY on a different exchange, or any USD index alternative).
One click alert configuration
Most multi signal indicators force you to set up a separate alert for each signal type. With 5 strategies and 4 exit types per strategy, that would mean configuring 20+ separate alerts. AsliGold MSC handles this with a single alert subscription.
1. With AsliGold MSC loaded on your XAUUSD H4 chart, click the alarm clock icon in TradingView’s top toolbar.
2. Click “Create Alert” to open the alert dialog.
3. In the Condition dropdown, select “AsliGold Multi-Strategy Confluence XAUUSD H4 v1”.
4. In the second dropdown that appears below, choose “Any alert() function call”.
5. Pick your notification method (push notification, email, SMS, or webhook).
6. Click Create.
That single alert covers every entry and every exit across all 5 strategies. The notification message tells you which strategy fired (B1 through B5), what the action was (LONG, TP HIT, SL HIT, or TIME EXIT), the price, and the SL and TP levels for entries or the realised R multiple for exits.
If you only want alerts for specific strategies, you can also use the granular dropdown options. The indicator exposes individual conditions named “BBMR Entry”, “LSweep Entry”, “Donch Entry”, “ATRBrk Entry”, and “Hammer Entry” for users who want a more selective alert setup.
How to size positions and manage risk
The indicator does not auto execute, so position sizing is in your hands. The recommended approach is fixed percent risk per trade. Here is how it works.
When a signal fires, the indicator gives you the entry price and the stop loss price. The distance between them is your stop loss in dollars per ounce. Decide what percent of your account you are willing to lose if the trade hits stop, then divide that dollar amount by the stop loss distance. The result is your position size in ounces.
For example, if your account is 10,000 USD, you risk 1 percent per trade (100 USD), entry is at 4,710 and stop is at 4,680, the stop distance is 30 dollars per ounce. 100 divided by 30 equals 3.33 ounces. That is your position size for this specific trade.
One percent risk per trade is a common starting point. More conservative traders use 0.5 percent. Aggressive traders go higher, but the math compounds quickly in both directions, so risking more than 2 percent per trade on a system with ~25 percent win rate is generally considered too aggressive.
Because the five strategies are uncorrelated, more than one may fire in the same week. Decide in advance whether you will take all signals, or cap the number of concurrent positions. A common approach is to limit total open risk to 3 to 5 percent of account at any given time. With 1 percent risk per trade, that means 3 to 5 simultaneous positions maximum.
Who this indicator is for
AsliGold MSC is designed for swing traders and position traders who want a systematic edge on gold without writing code. If you fit any of the following, this tool will likely save you time.
- You trade XAUUSD on H4 or higher and want a more diversified setup engine than a single indicator can provide
- You are comfortable with R multiple thinking and fixed percent position sizing
- You want the macro context (DXY direction, volatility regime, session timing) integrated into your signal generation, not as an afterthought
- You prefer to verify everything on your own chart history rather than trust a backtest report
- You want one alert that covers all your gold systems instead of managing many alerts
If you are a scalper looking for M1 or M5 signals, this is not the right tool. If you only trade futures or stocks, this is not the right tool. If you want a fully automated trading robot, this is not the right tool. AsliGold MSC is purpose built for manually executed XAUUSD H4 trading.
Read next
Frequently asked questions
Is the AsliGold MSC indicator free?
Yes. The indicator is published on TradingView as a protected source script, which means you can use it freely with no limitations. There is no paid tier, no subscription, and no ads. The source code is closed to protect the underlying logic, but the functionality is fully available to all TradingView users.
Does it work on lower timeframes like H1 or M15?
The strategies were validated on H4 OANDA XAUUSD data only. The signals will technically fire on lower timeframes if you change the chart, but the parameters were not tuned for those timeframes. If you want H1 or M15 systems on gold, those would need a separate research process and a different indicator.
Does it work on other symbols like silver or oil?
No. The strategies were tuned specifically for XAUUSD using its volatility profile, session structure, and DXY correlation. Applying them to silver, oil, indices, or crypto would produce signals but the edge is not guaranteed to transfer.
Why is it long only? Are short setups not viable on gold?
Across many configurations tested, short setups on gold consistently underperformed long setups. Gold is structurally a momentum and trend asset, with long term upward bias driven by inflation, central bank buying, and risk off flows. Adding short setups to the suite would have reduced overall edge. The decision to remain long only was data driven, not a preference.
Can I disable individual strategies?
Yes. The settings panel has a toggle for each of the five strategies under the “Strategy Enable” group. If you only want to follow BBMR and Donchian for example, disable the other three. The dashboard will still show their disabled status so you remember they are off.
What happens if the DXY data feed fails?
The DXY filter is used by three of the five strategies (BBMR, LSweep, ATRBrk). If the DXY feed is unavailable, those three filters cannot evaluate, and signals from those strategies will not fire. Donchian and Hammer will continue to work normally because they do not use DXY. If your TradingView plan does not include TVC:DXY, change the input to a different USD index symbol that you have access to.
Should I take every signal that fires?
That is your decision based on your account size, risk appetite, and other open positions. A common approach is to take every signal but cap the number of concurrent open trades (e.g. maximum 3 open at once). Another approach is to filter signals by your own bias, only taking trades when you also like the macro setup. Both work. The key is to be consistent, switching between rules tends to produce worse results than picking one and sticking with it.
Get AsliGold MSC on TradingView
Five long only XAUUSD H4 strategies in one chart. Live dashboard, R multiple tracking, one click alerts. Free to use, no limitations.
Open on TradingView →
See all AsliGold tools
Also available: free Telegram channel for live gold updates and trade discussions at t.me/livepriceaction
Have a question about the indicator or membership?
Risk disclaimer: Trading XAUUSD and other financial instruments involves substantial risk of loss and is not suitable for every investor. Past performance shown in the indicator dashboard is computed from historical chart data and does not guarantee future results. The AsliGold Multi Strategy Confluence indicator is a setup detection and trade tracking tool, not investment advice. You are solely responsible for your own trading decisions, position sizing, and risk management. Always test any system on a demo account before risking real capital. Read the full disclaimer before using this tool.