Gold price action trading starts with a chart, but a useful decision needs more than a candle pattern. You need to know what price is doing, which instrument you are looking at, how a position would behave if the idea fails, and whether the quoted entry is still available.
This learning guide connects the main parts of that process. Start with the section that answers your current question. You do not need to buy a tool, join a broker or copy a signal to work through the examples on this site.
1. Understand the chart before naming a pattern
A chart compresses transactions or quotes into a chosen timeframe. A five-minute candle and a daily candle answer different questions. Before calling a move a breakout, pullback or reversal, record the symbol, data provider, timeframe and level being discussed.
Describe the visible sequence in ordinary language. Are recent highs and lows moving higher, lower or sideways? Where did price previously change direction? Is the current candle closed? These observations are easier to review than a confident label added after the outcome is known.
The CME support and resistance lesson is a useful reference for the terminology.
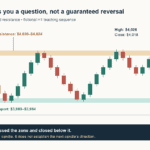
Support and resistance are areas to investigate, not walls that price must respect. Keep the original zone visible during a review. Moving it after every new candle can make almost any chart look predictable in hindsight.
Study a specific method
The gold liquidity-sweep strategy guide discusses one approach to failed breaks. Read its rules and limitations before treating a wick as a signal.
Compare a different market condition
The gold pullback guide addresses retracements within a trend. A pullback method and a reversal method should not be mixed without an explicit rule.
2. Add market context without turning it into a prediction
Gold trades across several products and venues. An XAUUSD CFD, a gold futures contract and physical bullion are not interchangeable instruments. Their quotes, contract sizes, financing arrangements and trading schedules can differ.
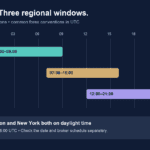
When planning a session, separate a market centre’s working hours from your instrument’s actual availability. A timezone conversion does not establish that your broker accepts orders at that moment. Daily breaks, holidays and maintenance can interrupt a normal schedule.
Our guide to trading gold around the clock explores that distinction. Confirm the current symbol specification rather than applying a general “24-hour market” statement to every gold product.
Economic releases add another layer. Compare a published number with expectations and then observe how the market responds. A news headline alone does not tell you the entry, stop, size or likely execution cost of a trade.
The gold market-analysis section provides dated context. Check the date before using any quoted level; a past weekly forecast is not a current trade instruction.
3. Measure exposure before thinking about profit
Lot size is a contract quantity, not a universal dollar risk. To estimate the loss at a planned stop, you need the entry-to-stop distance, volume and contract specification. Separate costs and an adverse fill can change the outcome.
For an illustrative USD-quoted gold contract with 100 ounces per lot, 0.02 lot represents two ounces. A $10 move against that position creates a $20 gross price loss. This is arithmetic, not a recommendation to use that volume or stop distance.
Margin asks a different question: how much collateral the account rules require for exposure. A small margin requirement does not make the position’s price sensitivity smaller. Leverage should never replace the dollar-loss calculation.
Use the existing gold profit and loss calculator to explore price-move arithmetic. Read its assumptions and reconcile completed trades with actual fills and account statements.
A useful sequence
Market idea → invalidation → exposure → costs → execution check. If a minimum position is already too large for the chosen loss budget, forcing a tighter stop changes the trading idea. A demo exercise or no trade remains a valid outcome.
4. Treat indicators as tools with assumptions
An indicator transforms data according to rules. It does not remove uncertainty. Before using one, identify its inputs, the conditions it is meant to describe, whether it waits for a closed candle, and what happens when market conditions change.
The Asligold TradingView toolkit directory organizes the site’s indicator and strategy resources. Use the individual guide to understand a tool’s purpose rather than combining every available indicator on one chart.
A historical result needs context. Look for the test period, instrument feed, position-sizing assumptions, costs, drawdown and number of trades. A reported win rate without the size of gains and losses cannot describe the full financial outcome.
Keep historical testing separate from forward observation. If you change a setting after seeing that it would have improved past trades, you have changed the hypothesis. Additional observations are needed before treating the revised version as evidence.
5. Read a signal as a plan that still needs checking
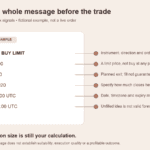
A signal message may contain a symbol, direction, entry, stop and targets, but important details can be missing. Check when it was issued, when it expires, whether the entry is a limit or market instruction, and how partial exits or updates are handled.
Your available entry can differ from the sender’s entry. So can your contract, account currency, costs and existing positions. Copying a lot number does not copy the sender’s risk percentage.
The Golden Circle information page explains the community offering. The community rules describe participation. Read educational ideas independently and keep the option to decline a trade.
When reviewing a provider, ask for complete results and clear terms. Screenshots of selected winners do not establish typical performance. Separate a useful discussion community from a promise that another person’s trade ideas will produce your desired outcome.
6. Understand the account and the referral relationship
Broker comparison begins with eligibility, the applicable legal entity and the actual product terms. Then examine contract size, spread, commissions, financing, order handling and withdrawal conditions. A promotional minimum spread is not a measured average execution cost.
Our Exness spread guide is a starting point for account-cost questions. Verify changing specifications against the broker’s current documentation and compare the same exposure under the same assumptions.
An introducing broker or affiliate relationship can create compensation for referrals or qualifying activity. That commercial relationship should be disclosed. It does not itself verify a trading strategy or make the partner an official representative authorized to act for the broker.
If you already have an account, the existing Exness partner-change guide covers the procedural topic. The broker’s current process, review and entity-specific terms control any request. Do not send passwords or verification codes to a community administrator.
7. Build a review you can reproduce
Choose one market, one timeframe and one clearly described idea for a practice session. Record the chart before the outcome. Write down the relevant zone, the condition being watched, the point at which the idea no longer applies, and the assumptions used for sizing.
After the observation, compare what happened with the original description. Did the condition actually occur? Was the candle still developing when you acted? Did the entry change? Was the final result affected by spread, costs, execution or an adjustment to the plan?
A useful journal includes skipped ideas as well as completed trades. Otherwise, the record can become a collection of attractive examples selected after the fact. Keep the denominator—the full set of eligible observations—visible when discussing a method.
Gold price action trading becomes easier to evaluate when observations, interpretations and money outcomes are recorded separately. You can improve a specific mistake, such as using the wrong quote side or changing a level after the event. You cannot reliably improve a vague conclusion that a chart “looked good.”
Questions about this learning path
Do I need several strategies at once?
No. Understanding one explicit set of rules and its limitations is more useful than collecting patterns without knowing when each applies. This guide is organized by questions so you can fill the specific gap in your process.
Can price action predict every gold move?
No. It is a way to interpret price behaviour and frame conditional ideas. Unexpected news, changing liquidity and ordinary uncertainty remain.
Is a calculator result a trading recommendation?
No. A calculator checks relationships between inputs. It cannot establish whether a market idea is sound or whether the entered execution assumptions will hold.
Where should a beginner start?
Begin with chart structure and instrument specifications, then practise the risk arithmetic in a demo setting. Use broker and community resources after understanding what information and decisions remain your responsibility.
Continue learning with the community
The free Live Price Action channel offers market discussion. Use the guides here to evaluate an idea before acting on it.
Some linked pages contain broker affiliate links, and qualifying activity may compensate this site. Leveraged trading involves substantial risk. Examples explain methods and arithmetic; they do not promise returns.
New practical lessons
New lessons appear here as they are published. Use the topic sections above to explore the existing library.