Hurst Cycle Indicator for Gold: DCL and DCH Windows Projected Before They Happen
Every gold trader knows the levels. Almost nobody knows the dates. This is the full guide to Hurst cycle trading on XAUUSD with the AsliGold Hurst Cycle Pro: an indicator that measures gold’s live cycle rhythm, marks every confirmed DCL, DCH, ICL and ICH, and draws the next timing windows on your chart in advance, as fixed boxes that never move. Built on a research sweep of more than 155,000 cycle configurations across 23 years of data.
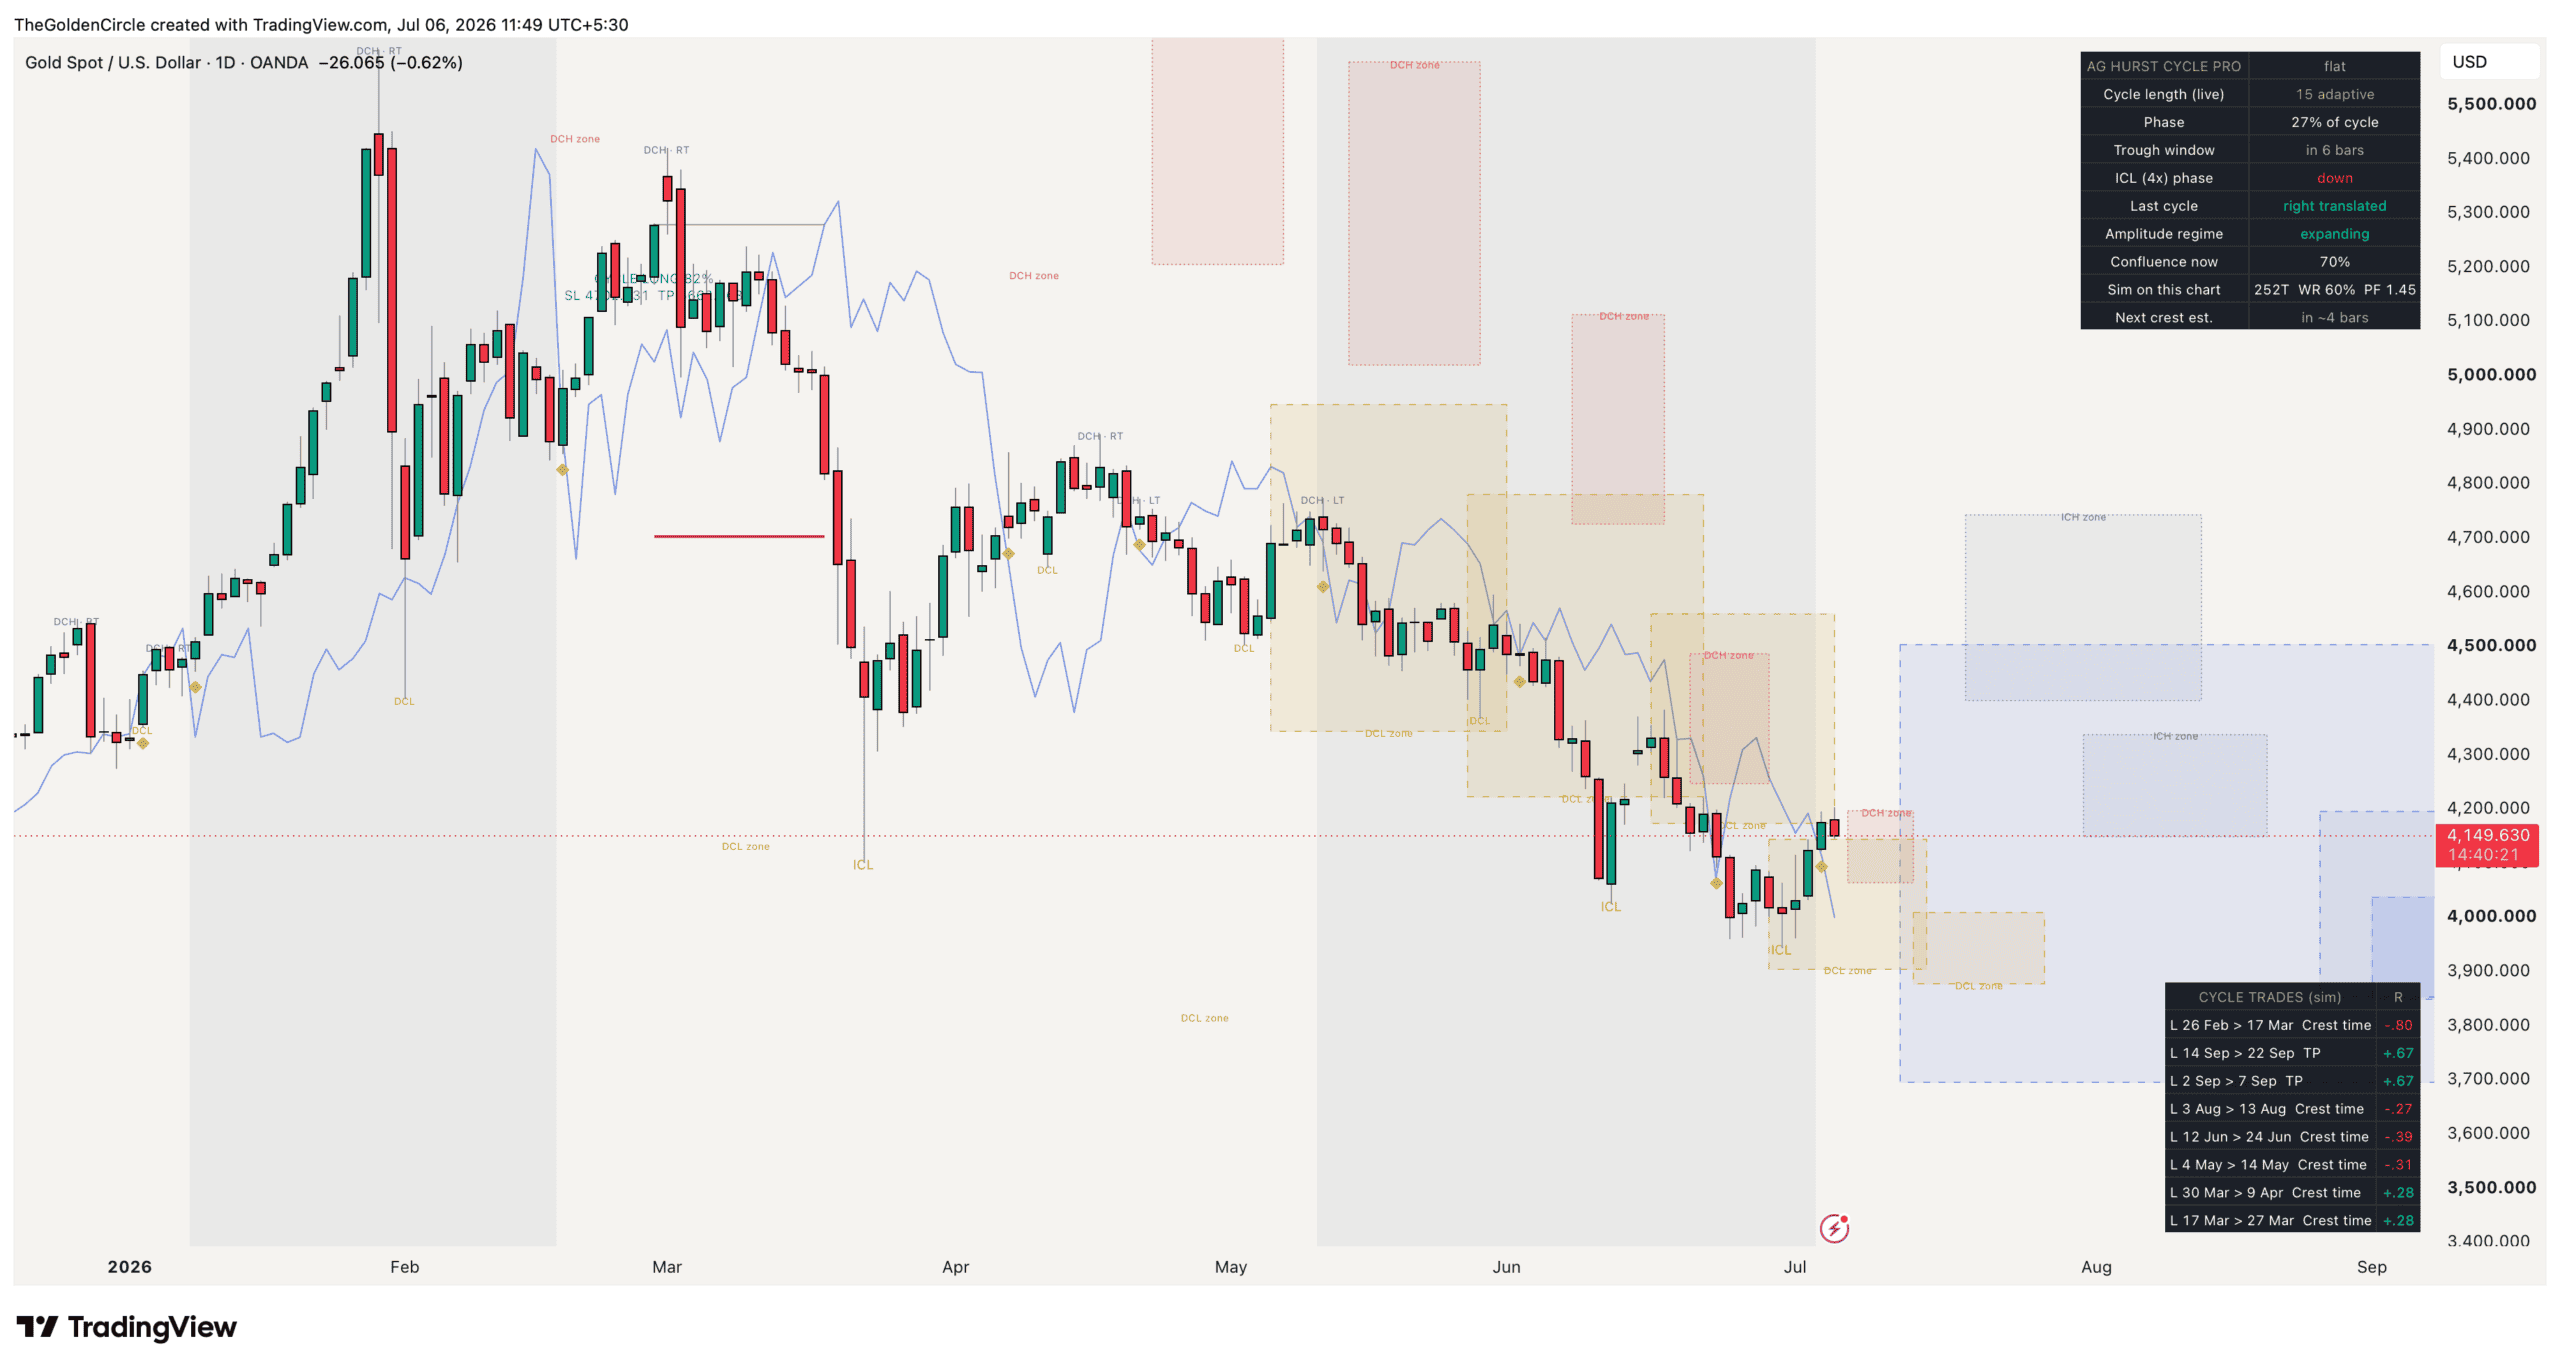
AsliGold Hurst Cycle Pro on a live XAUUSD daily chart: confirmed cycle lows and highs labeled, the next DCL and DCH windows projected forward as fixed price and time zones, and the live cycle dashboard top right.
What you will find inside
- The missing dimension: why price analysis alone leaves you half blind
- Who was J.M. Hurst, and why gold obeys him better than most markets
- DCL, DCH, ICL, ICH and translation, explained (interactive)
- What the Hurst Cycle Pro actually does
- The killer feature: windows projected in advance, drawn once, never moved
- The research: 155,000 configurations and one honest verdict
- Reading the cycle dashboard in 30 seconds
- Nesting timeframes: the daily cycle on your intraday chart
- Frequently asked questions
- How to get access
The missing dimension: why price analysis alone leaves you half blind
Open any gold analysis on the internet and you will find the same furniture: support here, resistance there, a trendline, maybe a supply zone. All of it answers one question: WHERE might price turn. Almost none of it answers the other question: WHEN.
Yet every experienced gold trader has lived the frustration of being right about the level and wrong about the timing. You buy the support zone, it holds, and price then grinds sideways for three weeks before the real move starts, shaking you out twice along the way. The level was correct. The clock was missing.
Cycle analysis is the discipline of the clock. It starts from an observation that has held on gold for decades: the market does not move randomly between its lows. It breathes in a measurable rhythm, low to low, and that rhythm, while never perfectly regular, is regular enough to project a window in time where the next low is statistically due. Combine the window with price confirmation and you get something almost no chart analysis offers: a forecast with a date on it, which means a forecast that can be graded.
Who was J.M. Hurst, and why gold obeys him better than most markets
J.M. Hurst was a NASA aerospace engineer who, in the late 1960s, applied signal processing mathematics to stock prices and published what many still consider the most rigorous framework for market timing ever written. His core findings: markets move in nested cycles of different lengths, shorter cycles live inside longer ones, cycles are measured trough to trough, and the position of the crest within a cycle carries information about the larger trend.
Hurst also gave traders a beautifully simple mechanical tool, the FLD or Future Line of Demarcation: the price itself, displaced forward in time by half a cycle. When price crosses above its own half cycle displacement, a new cycle upswing is mechanically confirmed. No smoothing, no oscillator, no lag in the usual sense. Just price measured against its own rhythm.
Why does this framework suit gold specifically? Because gold is one of the most rhythm respecting major markets in the world. Its daily cycle, running roughly three to six trading weeks trough to trough, is tracked by a whole community of professional cycle analysts, and our own data agrees: in the research behind this indicator, gold’s measured cycle lengths clustered tightly around the classic Hurst nominal values, decade after decade. The rhythm is real, measurable, and persistent.
DCL, DCH, ICL, ICH and translation, explained (interactive)
Five terms carry the entire language of gold cycle analysis. Click each card for the plain language definition and what the indicator does with it.
What the Hurst Cycle Pro actually does
Classic Hurst tools ask you to supply the cycle length yourself. The Hurst Cycle Pro measures it. The engine tracks actual confirmed trough to trough spans and uses their recent median as the live cycle length, re-learning continuously as market structure changes. When gold’s rhythm compresses in a volatile phase or stretches in a quiet one, the analysis follows it without you touching a setting.
On top of that adaptive engine, the indicator maintains the full Hurst picture automatically: every DCL and DCH labeled with clean, background free text, ICL and ICH detection for the intermediate degree, translation verdicts on every completed cycle, the adaptive FLD line, and a consolidation shading that appears when cycle amplitude contracts below its recent norm, the environment where cycle trades historically underperform. A confluence percentage summarises how many of the framework’s favourable conditions are aligned right now.
The killer feature: windows projected in advance, drawn once, never moved
Here is the feature that separates this tool from every cycle script we have seen on TradingView. The moment a DCL confirms, the indicator projects forward and draws two boxes: the window in price and time where the coming DCH is statistically due, and the window where the NEXT DCL is due after that. When the confirmed trough is an intermediate low, it additionally projects the ICH and next ICL windows, one and two degrees out.
These boxes are drawn once, at the moment of confirmation, and they never move. Not one pixel. Run TradingView’s bar replay and you will watch price walk into zones that were drawn weeks earlier, or miss them, because sometimes it misses, and a miss is information too: a market that cannot reach its projected crest zone is telling you the cycle is weak. Past windows stay on the chart as a permanent audit trail of the engine’s timing accuracy. Nothing is quietly redrawn to look smart in hindsight.
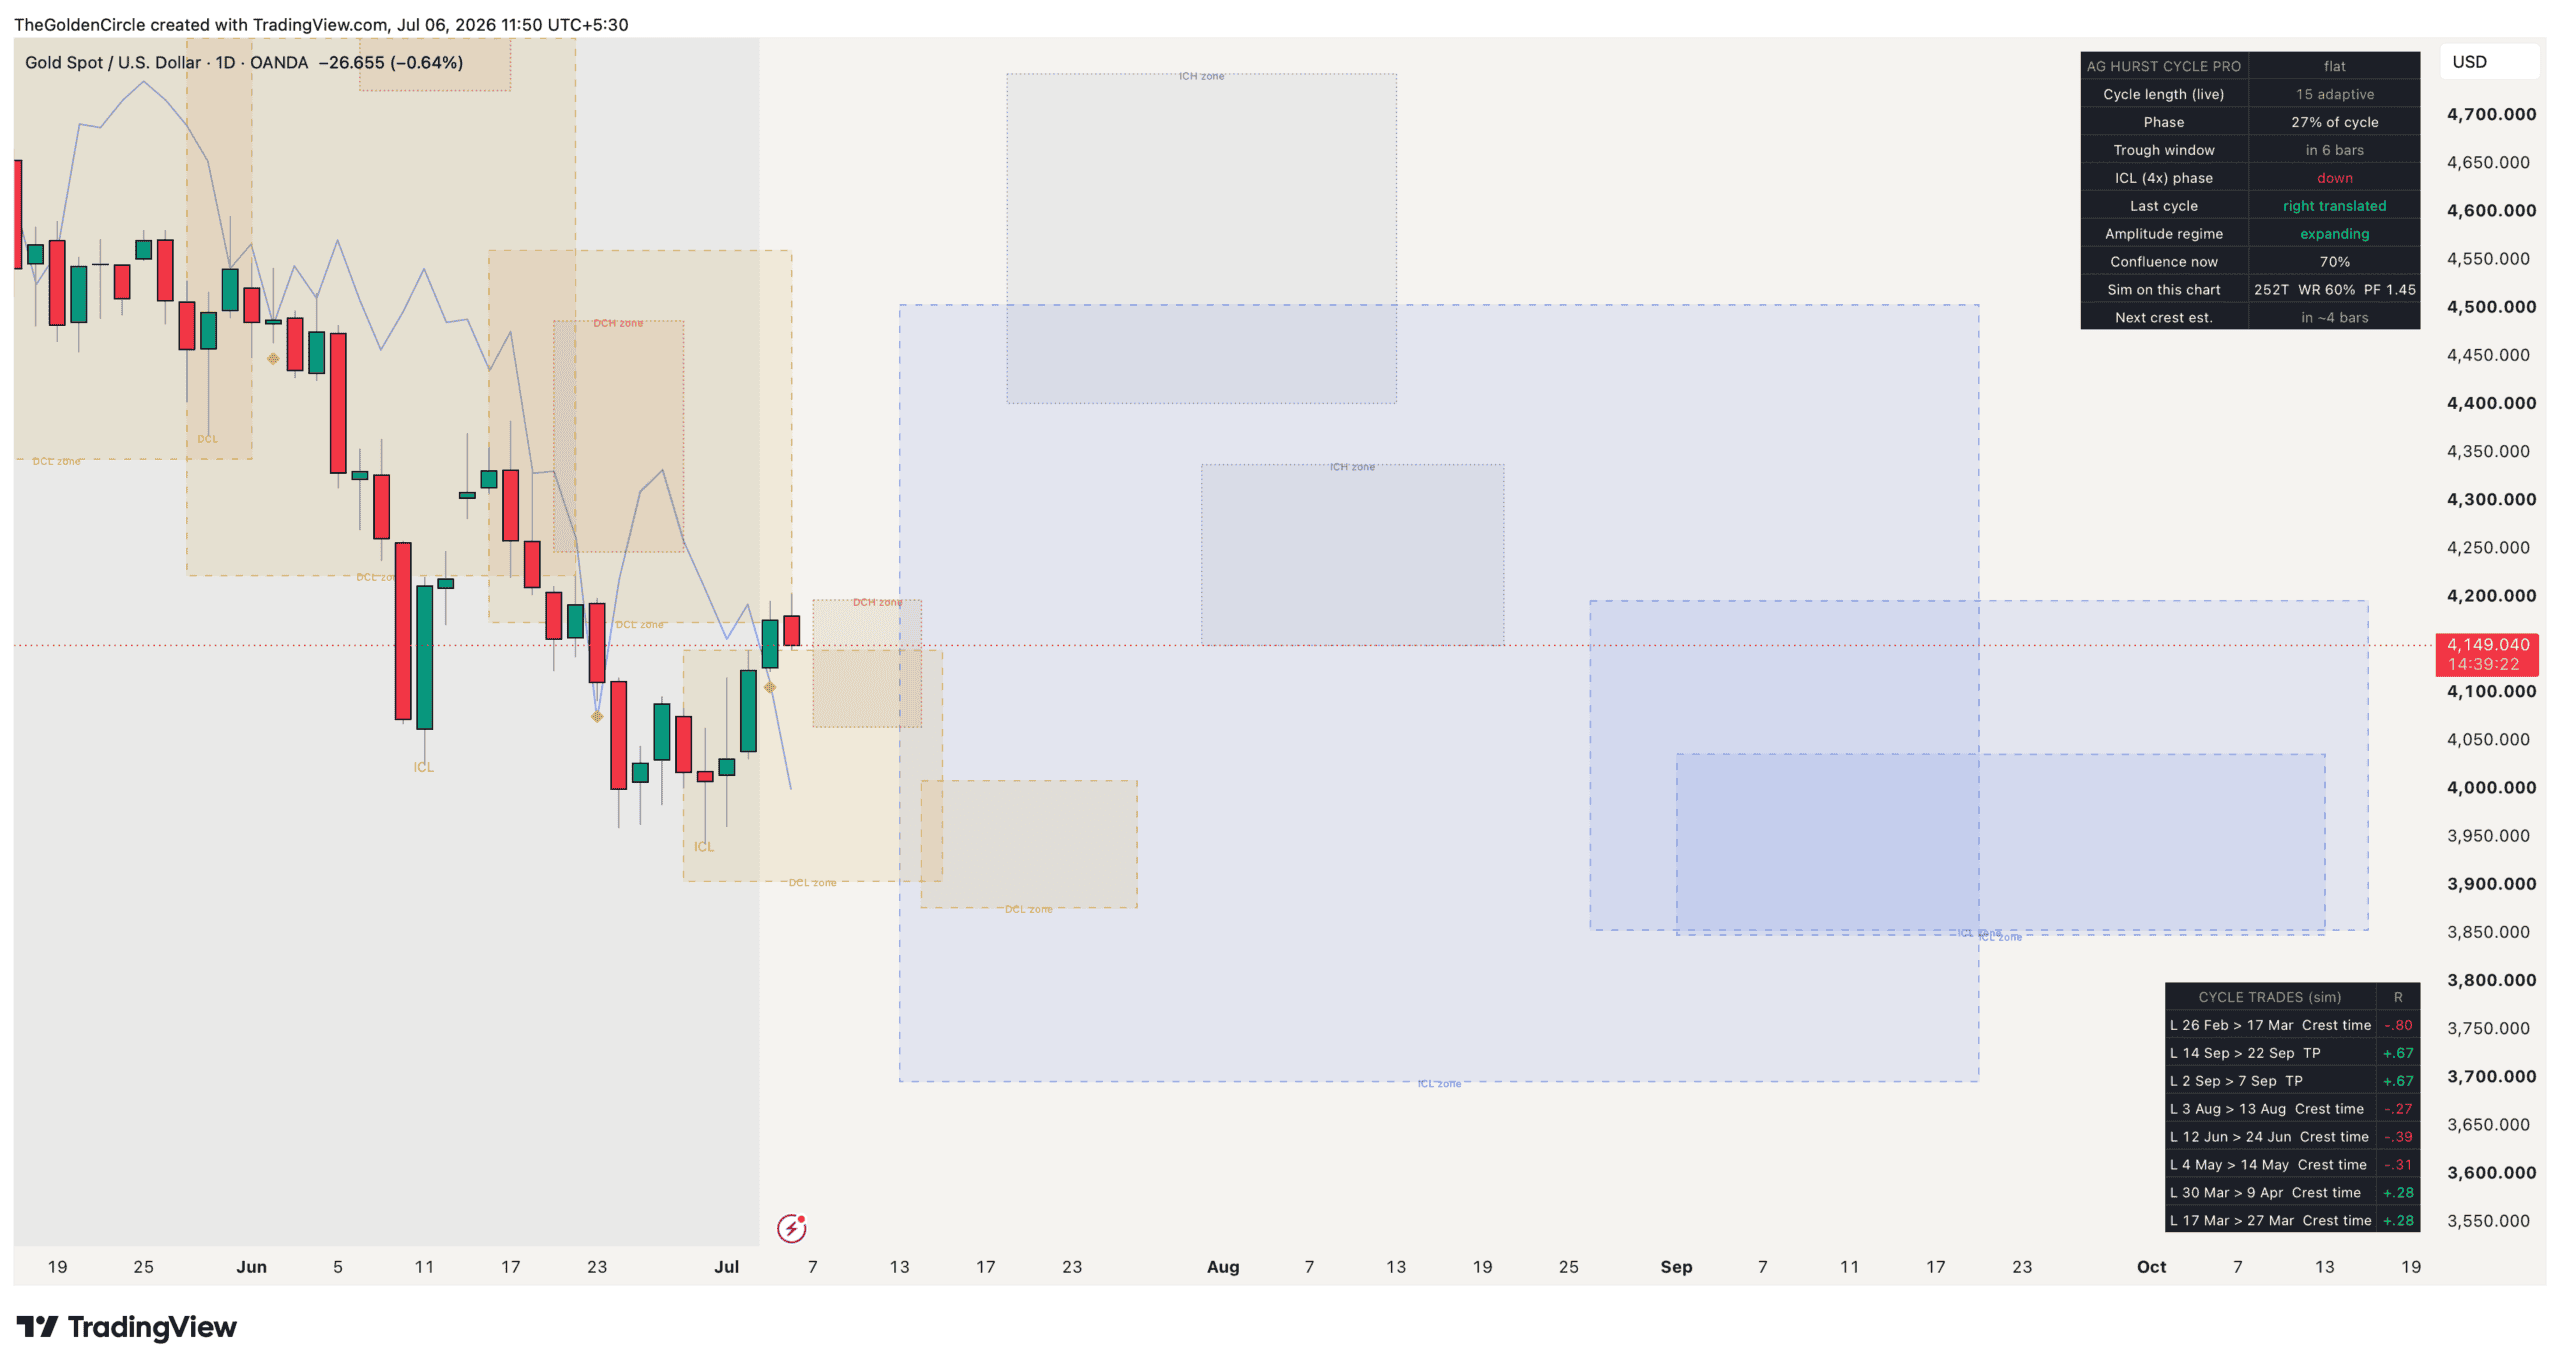
Next week, drawn on this week’s chart: the projected DCH zone overhead, the coming DCL window below, and the intermediate cycle zones months out. Every box is fixed at the moment of confirmation and never repaints.
The research: 155,000 configurations and one honest verdict
Before a single line of this indicator was written, the underlying framework went through the same quantitative gauntlet as every AsliGold system: more than 155,000 cycle configurations tested across 23 years of gold data on daily, four hour, and one hour timeframes, with the design period strictly separated from the out of sample verification years.
Three findings shaped the tool. First, trough timing windows combined with price confirmation carried a genuine, robust long side edge on gold at every cycle length tested, with out of sample results comfortably stronger than the design period, the signature of a real effect rather than curve fitting. Second, the adaptive cycle measurement, where the engine learns the length from the market instead of using a fixed number, held its edge across the whole surface, which is why it is the default. Third, and most importantly for your safety: crest based short setups failed in every single era. Gold punishes cycle top shorting, consistently, across two decades. The indicator therefore treats crest windows as profit taking and caution zones, never as short signals, and says so openly.
Reading the cycle dashboard in 30 seconds
The compact dashboard in the corner of the chart is a complete cycle briefing. Top to bottom: the live measured cycle length and whether it is adaptive, the current phase as a percentage of the cycle, the countdown to the next trough window, the intermediate cycle phase (the single most important cell on the panel), the translation verdict of the last completed cycle, the amplitude regime, the current confluence percentage, a running simulation scoreboard computed on your own chart, and the estimated timing of the next crest.
Read in order, those cells produce a spoken market summary in under half a minute. It is, not coincidentally, the exact sequence we use to open the cycle segment of our own weekly gold analysis videos.
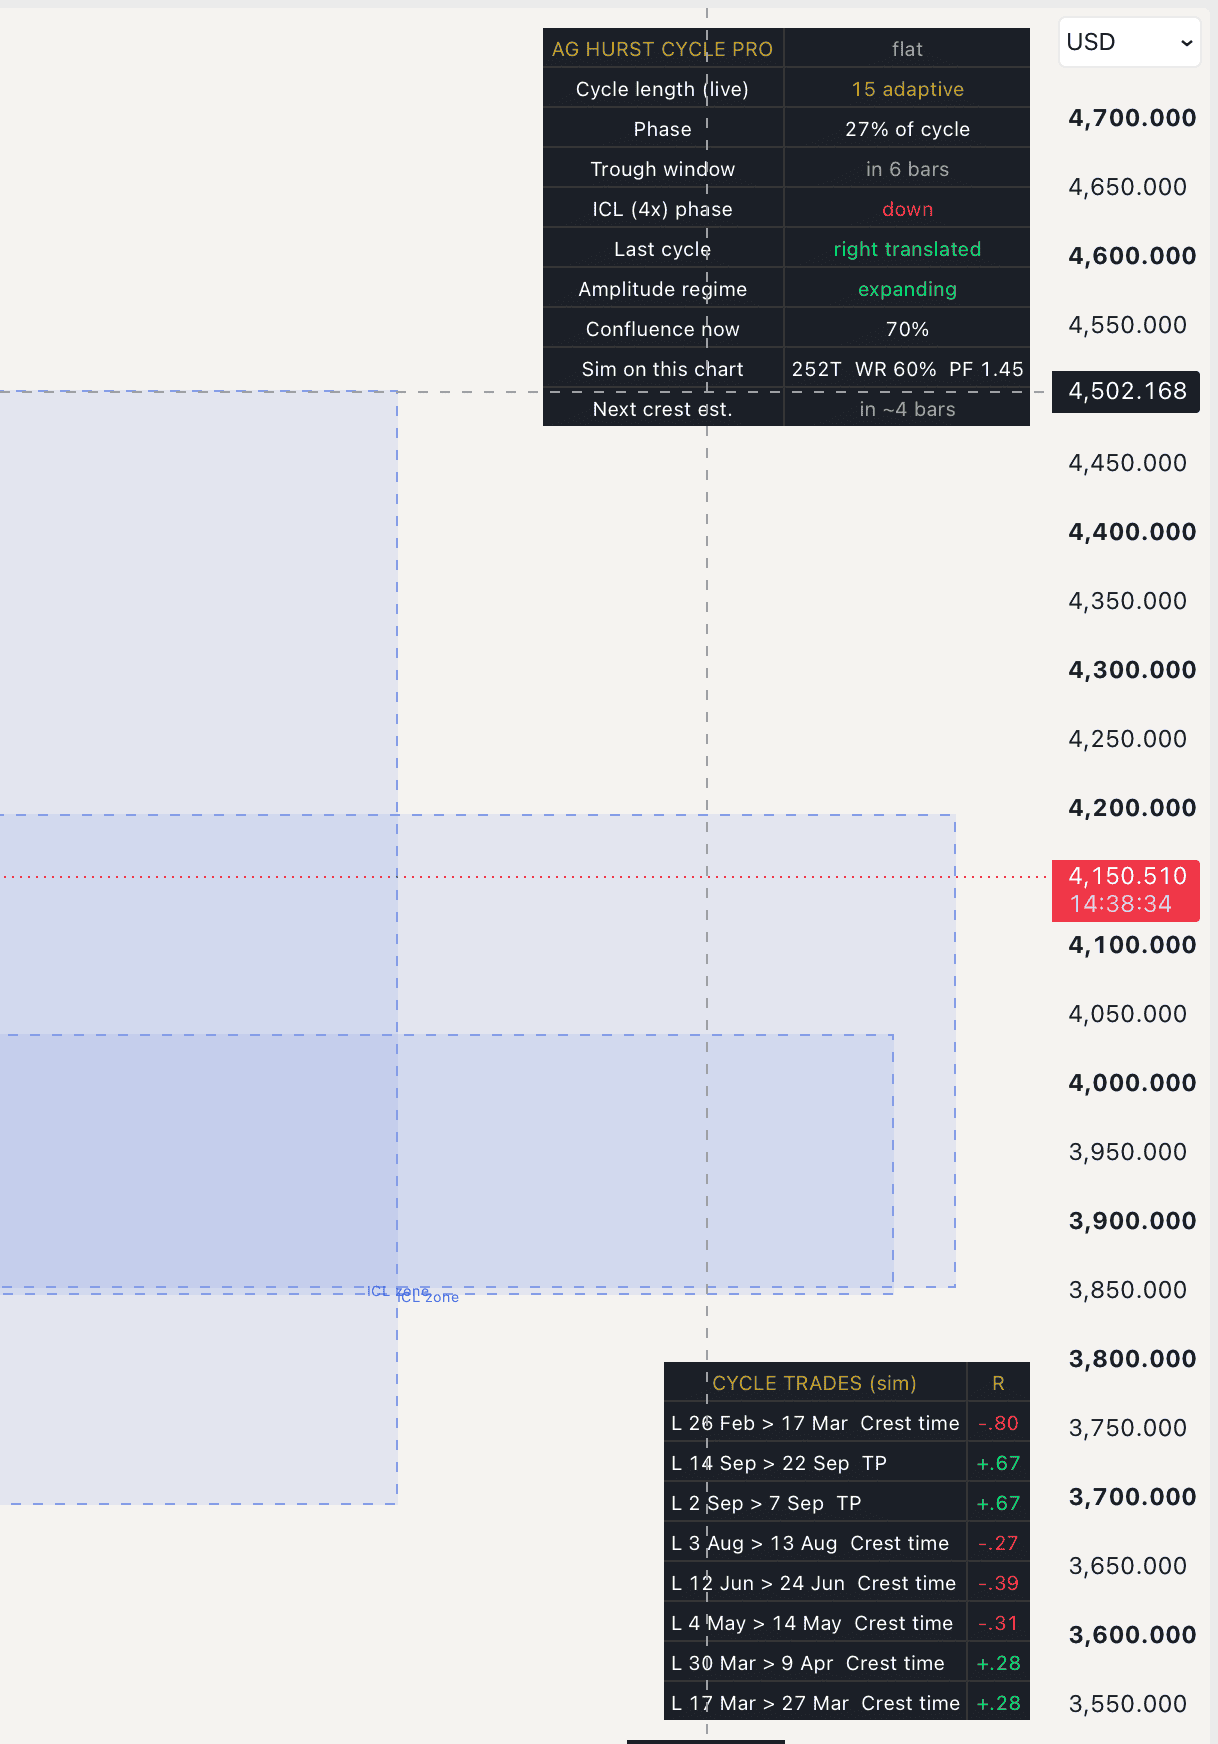
The cycle dashboard: rhythm, phase, countdown, the bigger tide, and the honest scoreboard, in one glance.
Nesting timeframes: the daily cycle on your intraday chart
Hurst’s deepest insight was nesting: every cycle lives inside a larger one, and the highest probability turns happen when multiple degrees bottom together. The Hurst Cycle Pro makes nesting visual. Enable the higher timeframe overlay and your four hour chart shows the DAILY cycle’s projected trough and crest windows as time anchored zones, alongside the four hour cycle’s own windows.
When the intraday trough window opens inside the daily trough window, you are looking at the setup the whole framework exists to find: two clocks striking together. Intraday traders get the timing precision of their own timeframe with the context of the larger rhythm, on one chart, without flipping between layouts.
Read next
Frequently asked questions
What is a Hurst cycle indicator?
A tool that applies J.M. Hurst’s cyclic theory to a chart: it detects the market’s dominant trough to trough rhythm, marks confirmed cycle lows and highs, tracks the FLD, and projects the timing windows where the next turns are statistically due. The Hurst Cycle Pro adds adaptive cycle measurement, fixed price and time target zones, translation verdicts, intermediate cycle context, and a live dashboard on top of that classic toolset.
Does it repaint?
No. Every label is placed on confirmed information only, projection boxes are drawn once at the moment of confirmation and never moved, and past windows remain on the chart permanently as an audit trail. The indicator is explicitly designed so that bar replay shows exactly what a live trader would have seen on every historical day.
Which timeframes and markets does it work on?
The research behind it was performed on gold across daily, four hour, and one hour timeframes, and gold is where we use and trust it. The adaptive engine will measure any liquid market’s rhythm, and members do run it elsewhere, but our validated statements apply to XAUUSD specifically. The higher timeframe overlay works on any intraday chart.
Why does it not give short signals at projected tops?
Because the data said no. Across every era of our 23 year, 155,000 configuration research sweep, crest based short setups on gold failed validation. Projected crest windows are presented as profit taking and caution zones, which is what they were historically good for. A tool that ignores its own research to give you more signals would be a worse tool.
Is this the same as the cycle analysis famous gold cycle analysts do on X?
Same framework, automated and quantified. The DCL, DCH, ICL and translation language is identical to what the gold cycle community uses. The difference is that the Hurst Cycle Pro measures the cycle length adaptively instead of by eye, commits its projections to fixed boxes in advance, and keeps a running accuracy record on your chart instead of in anyone’s memory.
Do I need to know Hurst theory to use it?
No. The dashboard translates everything into plain readings: cycle length, phase, countdown to the next window, bigger cycle up or down, last cycle bullish or bearish shape. This article plus thirty minutes with the tool covers everything needed. Members also receive the reading guide and our weekly video walkthroughs where we read the same dashboard live.
Get the Hurst Cycle Pro on your charts
Adaptive cycle detection, DCL and DCH windows projected in advance, intermediate cycle context, translation verdicts, and the live dashboard. Access is included in the Golden Circle Pro membership together with the full library of validated systems and the research behind every tool.
Join Golden Circle Pro on YouTube →
Follow Gold Cycle Updates on Telegram →
Choose the Golden Circle Pro tier when you join to unlock tool access and the full library. Cancel anytime through YouTube. Free weekly cycle readings on the Telegram channel.
Have a question about the Hurst Cycle Pro or membership?
Risk disclaimer: Trading gold (XAUUSD) and other financial instruments involves substantial risk of loss and is not suitable for every investor. All research statistics referenced in this article are historical backtest results; past performance never guarantees future results and cycle projections are statistical windows, not certainties. The AsliGold Hurst Cycle Pro is an analysis and education tool, not investment advice, and it does not place trades. You are solely responsible for your own trading decisions, position sizing, and risk management. Always test any approach on a demo account before risking real capital. Read the full disclaimer before acting on anything you read here.