The 99% Win Rate Trading Strategy Is Real. Here Is the Catch Nobody Tells You
A system that won 260 of its last 261 trades across 23 years of gold data, verified on TradingView’s own Strategy Tester. Then five more like it on five more markets. This is the full, honest story of the AsliGold Sentinel Suite: what a real ultra high win rate system looks like, why it exists, and the one trade-off that every seller of “guaranteed wins” is hiding from you.
What you will find inside
- The numbers first, because you will not believe them otherwise
- Why almost every high win rate claim online is fake
- The architecture: how a 98% win rate is actually engineered
- The catch: win rate and returns are enemies
- The six Sentinels (interactive)
- The Sentinel Suite Tracker: all six on one chart
- The honest math: what 100% never means
- How serious traders actually use a system like this
- Frequently asked questions
- How to get access
The numbers first, because you will not believe them otherwise
In July 2026 we finished a research project that started as an attempt to prove something could NOT exist. The goal was to search every reasonable configuration of entry, filter, and exit across 23 years of market data and demonstrate, with numbers, that trading systems with win rates above 90 percent are a marketing fiction. More than half a million configurations went through the test engine.
We failed to prove it. Instead, the search found a small family of systems that are real, and the flagship result is this: a long only gold system that, when rebuilt in Pine Script and run through TradingView’s own Strategy Tester on OANDA data, closed 260 winners out of 261 trades since 2003. That is a 99.62 percent historical win rate, a profit factor above 12, and a maximum drawdown of 1.1 percent, computed by TradingView’s engine, not by us. The single losing trade happened in October 2024. One loss, in twenty three years.
| Metric | Flagship gold Sentinel | Full six system suite |
|---|---|---|
| Historical trades | 261 (2003 to 2026) | 450 since 2019 alone |
| Winning trades | 99.62% (260 of 261) | 98.0% blended |
| Profit factor | 12.4 | 4.8 |
| Max drawdown | 1.10% | under 2R historically |
| Source | TradingView Strategy Tester | Internal tracker simulation on TradingView data |
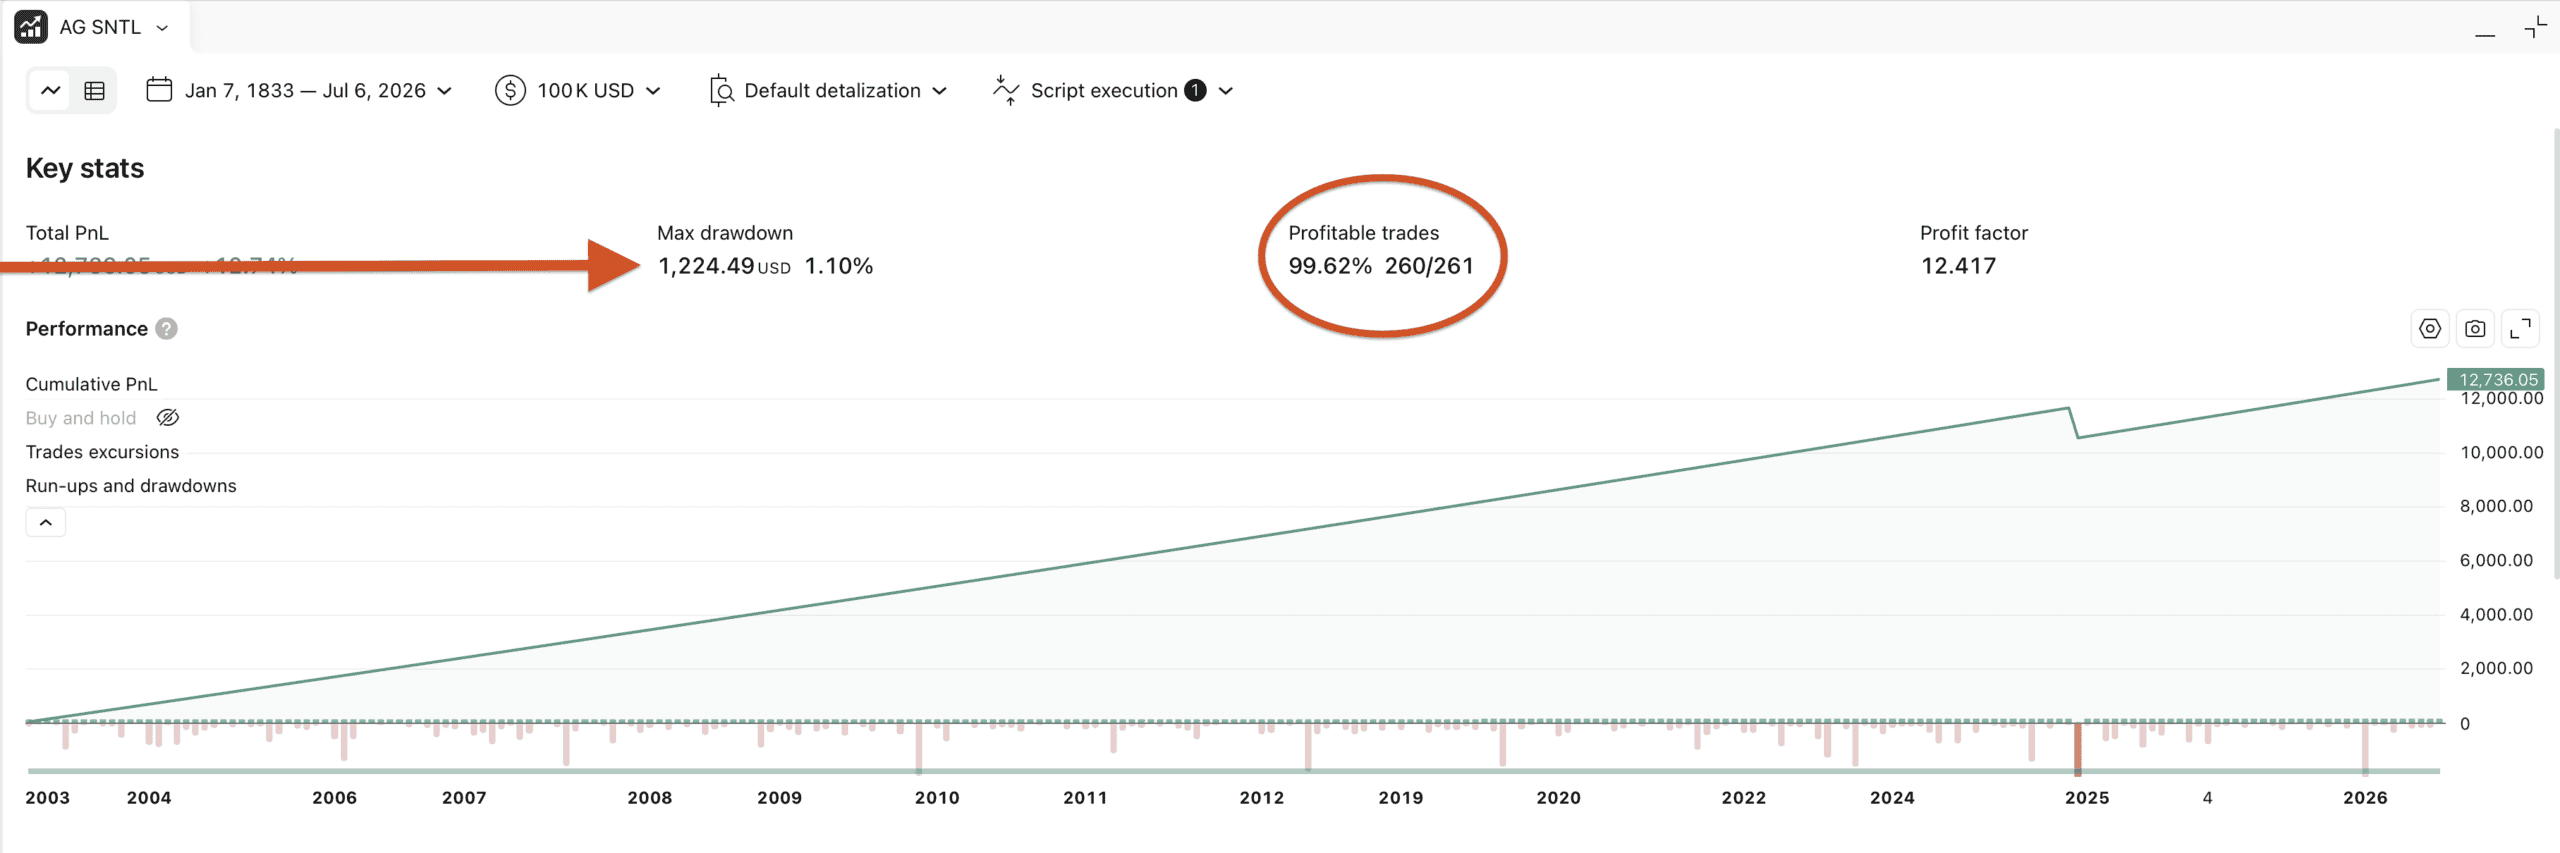
The flagship gold Sentinel in TradingView’s Strategy Tester: 260 winners out of 261 trades across 23 years, computed by TradingView’s engine on OANDA data, not by us.
Every number above is past tense and historical. Nothing on this page promises future results, and by the end of this article you will understand exactly why that distinction is the whole point.
Why almost every high win rate claim online is fake
Search for “high win rate trading strategy” and you will find hundreds of articles quoting 60, 70, sometimes 77 percent. Search for “99 percent win rate” and you will find Telegram signal sellers, screenshot factories, and martingale robots that blow up the moment volatility arrives. The pattern behind almost every fake claim falls into one of three buckets.
First, the martingale trick: double the position after every loss so the account shows a long streak of “wins” until one day it shows nothing at all. Second, the screenshot trick: post only the winners, delete the losers, no independent record exists. Third, the no exit trick: never close losing trades, so the win rate on closed trades looks perfect while the account drowns in open drawdown.
All three have the same tell: you cannot verify them. There is no neutral engine computing every trade on data the seller does not control.
The architecture: how a 98% win rate is actually engineered
Here is the part no signal seller will ever explain, because explaining it kills the fantasy. An ultra high win rate is not found. It is engineered, through a very specific and slightly uncomfortable exit structure.
Every Sentinel system does three things. It waits for an entry condition so statistically strong that the market almost never moves far against it afterward. It places a take profit target that is deliberately close to the entry. And it places a protective stop that is deliberately very far away, several times further than the target.
Think about what that geometry does. After a genuinely strong entry event, price ticking a small distance in your favour within a few days is close to inevitable. Price collapsing a large multiple of that distance without ever ticking up first is historically rare to the point of almost never happening. The win rate is not magic. It is the shape of the exits wrapped around an entry with a real edge.
The flagship gold system holds a typical trade for around one day. Most entries reach their small target within a session or two. In the entire 23 year record, the wide protective stop of the flagship was never once touched; the single loss in the research build came from a time based exit, not the stop. That is what a structurally strong entry condition looks like in the data.
The catch: win rate and returns are enemies
We promised the catch, and here it is, stated as plainly as we can. Each win is small by design. When your target is a fraction of the distance to your stop, every winner pays a fraction of the amount you risked. Winning 98 percent of the time with small wins produces a smooth, calm, steadily rising equity curve, and a modest one. At a conservative one percent risk per trade, the whole six system suite historically added around two percent per year. Read that again. Two percent, for 98 percent winners.
This is not a flaw. It is a law. Win rate and return per trade sit on opposite ends of a see-saw, and no honest system escapes it. A 40 percent win rate trend follower with big winners can compound wealth. A 98 percent win rate suite cannot, at the same risk. What it CAN do is something the trend follower never will: deliver green week after green week after green week, with a drawdown so shallow it barely registers.
What buying certainty looks like: a smooth, calm, steadily rising curve. The trade-off for that smoothness is the entire subject of this article.
The six Sentinels (interactive)
One ultra reliable system is a curiosity. Six of them, on six different markets, firing on different days, is an instrument. Each Sentinel passed the same gauntlet: out of sample validation on data it never saw during design, profitability in four separate market eras, statistical stress tests on the loss rate itself, and finally TradingView verification. Click each card for its profile. Exact entry rules and parameters stay inside the Golden Circle; the concepts are described honestly.
The Sentinel Suite Tracker: all six on one chart
Running six systems on six markets normally means six charts, six alert sets, and a spreadsheet. The AsliGold Sentinel Suite Tracker collapses all of it into a single TradingView indicator that members load on one daily chart.
The tracker simulates every member with the exact engine rules and shows a live dashboard: which Sentinel is armed for the next daily open, which positions are live with their entry, stop, and target, how many bars each trade has left on its clock, and a suggested position size computed from your own account equity and risk setting. Below it, a rolling history panel lists the most recent closed trades with dates, exit reasons, and R multiples. A single alert subscription covers every entry across all six systems, delivered to your phone with the direction, the levels, and the time stop already written out.
The header row keeps score honestly: total simulated trades, the live win rate, the profit factor, and the running R total since 2019, updating with every new bar. Members do not have to trust a screenshot from us. The scoreboard runs on their own chart, on TradingView’s data, every day.
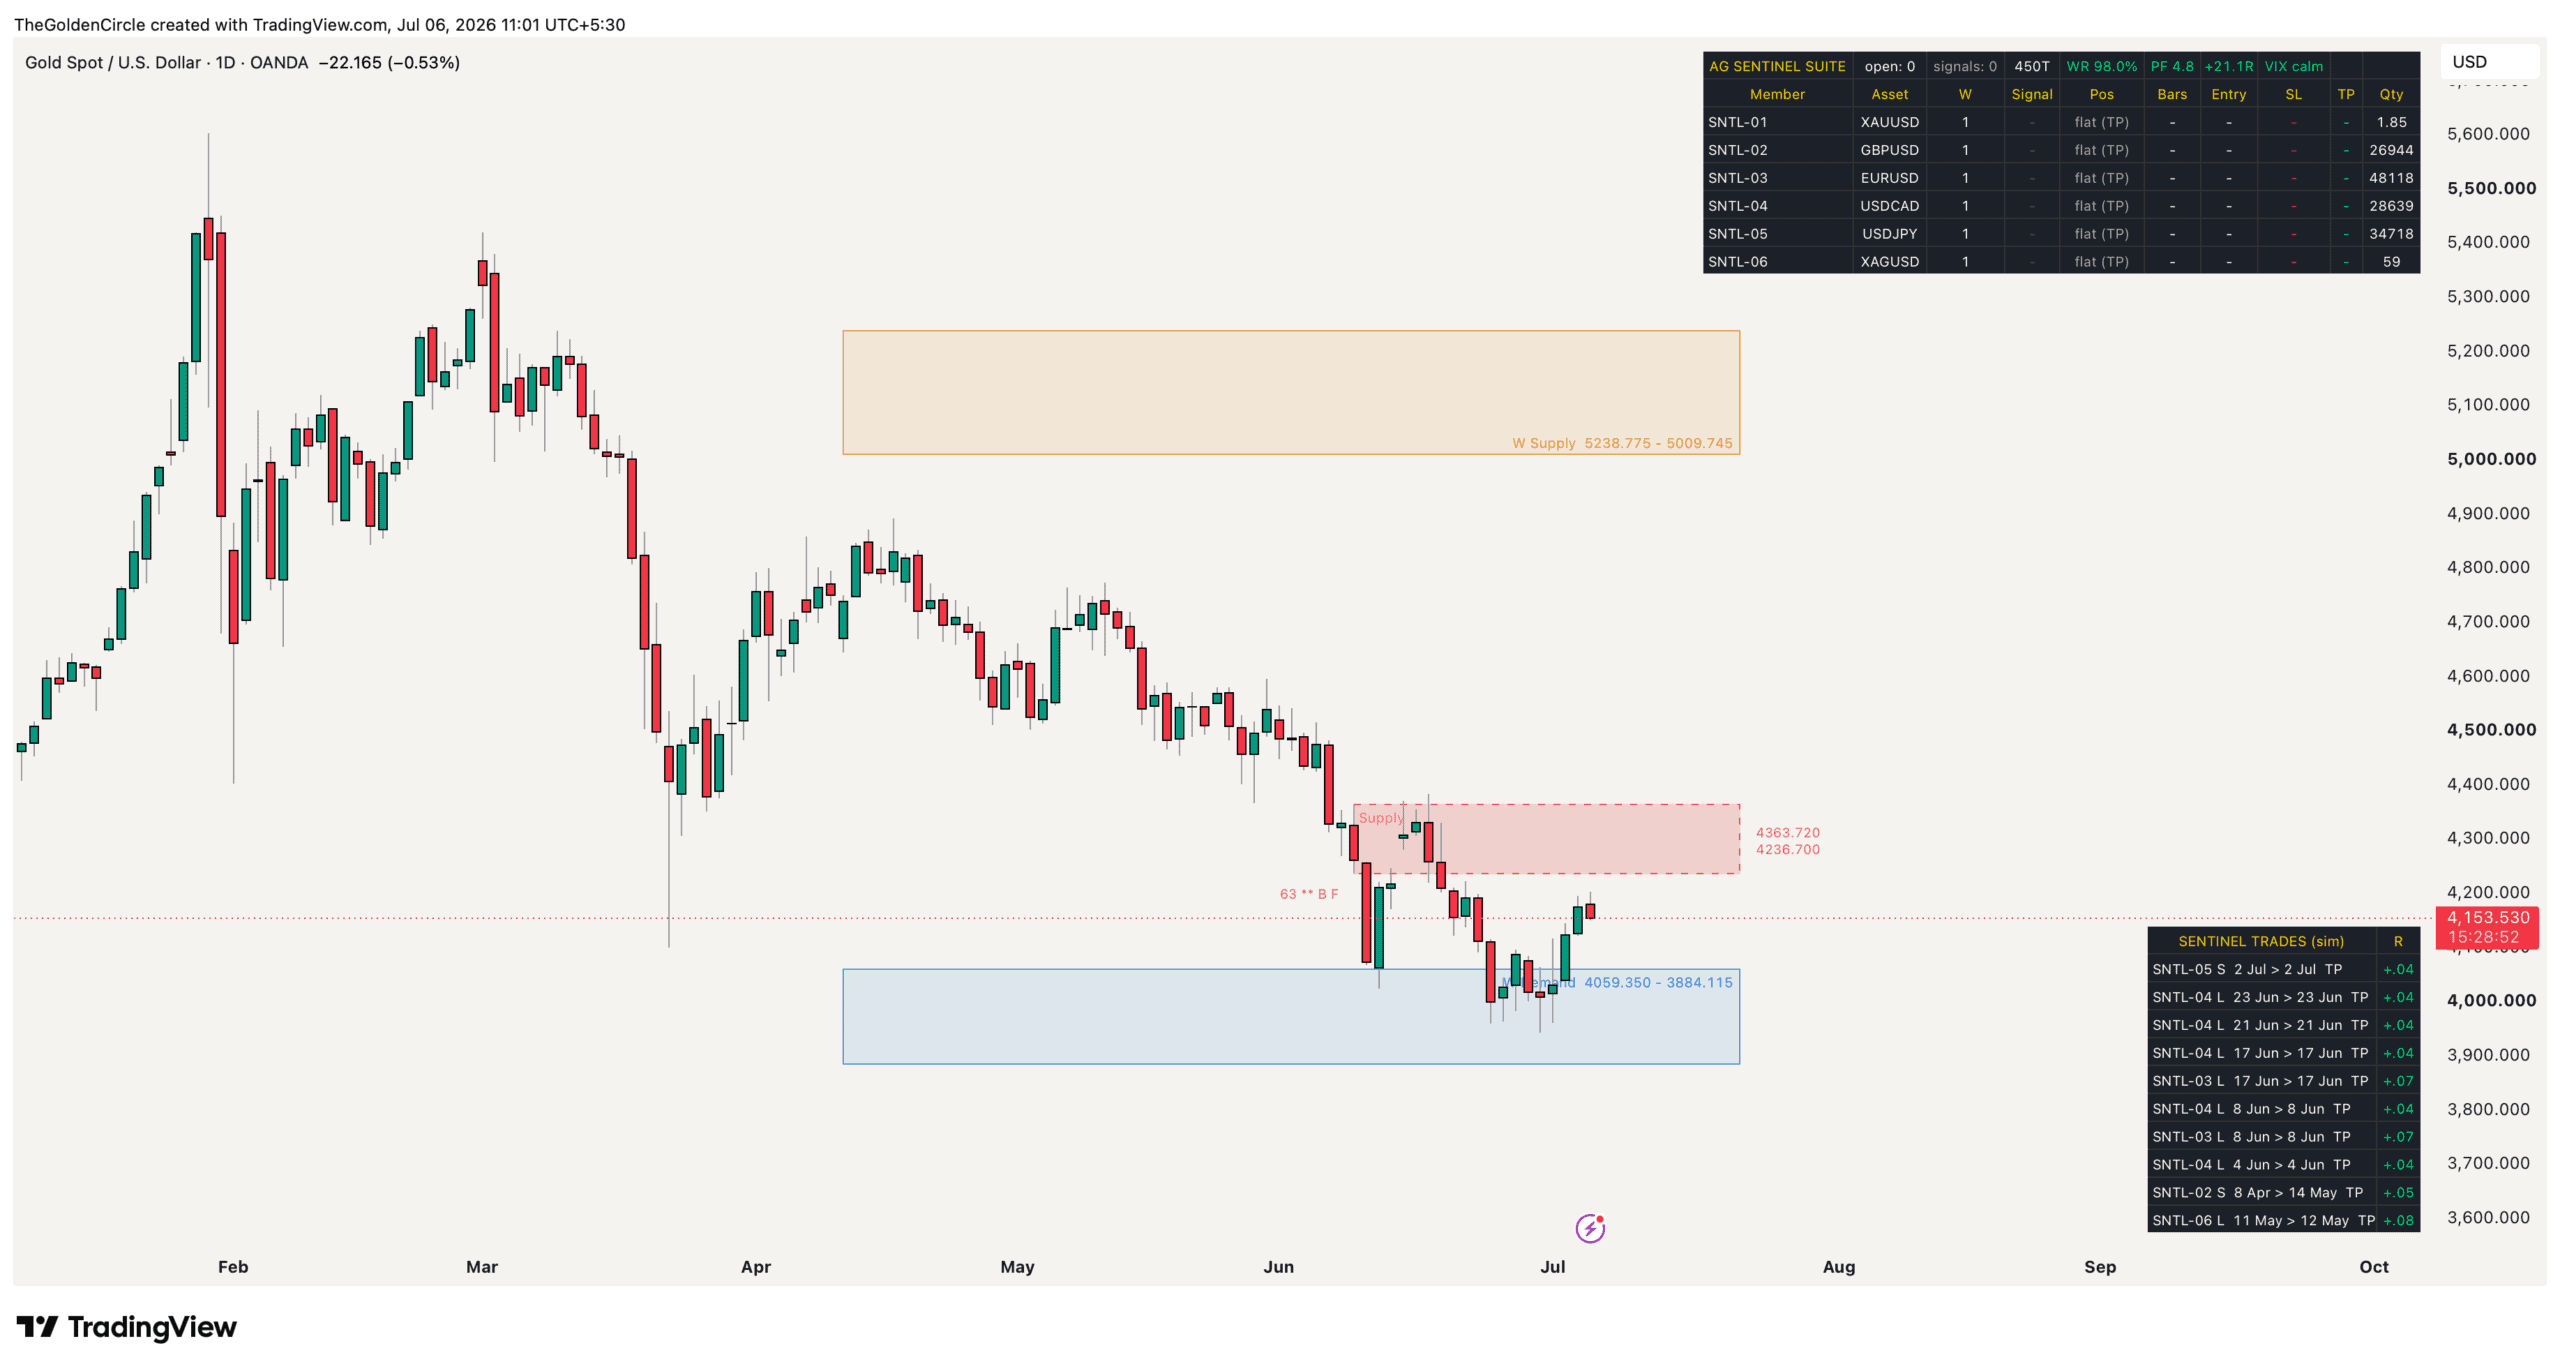
The Sentinel Suite Tracker running live: all six systems, current positions, suggested sizing, and the honest running scoreboard on a single daily chart.
The honest math: what 100% never means
During validation, several configurations showed literally zero losses in the out of sample window, dozens of trades without a single red number. It is tempting to call that a 100 percent win rate system. It is also wrong, and understanding why will make you a sharper judge of every performance claim you ever read.
Zero observed losses does not mean zero true loss probability. It means the sample was not big enough to observe one yet. Statistics gives an honest way to state this: with one loss in a few hundred trades, the confidence interval says the true loss rate could plausibly be as high as three percent. Our validation standard required each Sentinel to remain profitable even at that worst case loss rate, not just at the observed one. Systems that only worked at the observed rate were rejected, including some with spectacular headline numbers.
And the stop losses that were never hit in 23 years? They will be hit someday. Every member of our community sizes these systems with that day already priced in. That is not pessimism. That is the difference between trading a system and believing in one.
How serious traders actually use a system like this
Given the catch, what is a 98 percent suite actually FOR? Three things, in our experience.
The consistency anchor. Most traders quit systems during quiet or losing stretches, not because the edge died but because their conviction did. A stream of small, near certain wins arriving almost weekly is the psychological ballast that keeps a trader executing their main strategies through the inevitable rough patches.
The conviction signal. When a Sentinel fires, it is reporting that one of the statistically strongest conditions in two decades of data just occurred on that market. Experienced members treat Sentinel days as high conviction context for their broader positioning, which is often worth more than the Sentinel trade itself.
The proof of process. A verifiable 98 percent record is the clearest possible demonstration that systematic research, honest validation, and disciplined exits produce results that discretionary guessing never will. For traders learning the systematic path, the Sentinel Suite is the most convincing classroom we have ever built.
Read next
Frequently asked questions
Is a 99 percent win rate trading strategy actually possible?
Historically and verifiably, yes. The flagship gold Sentinel closed 260 of 261 trades as winners across 23 years on TradingView’s Strategy Tester. But it is only possible with an exit architecture where every win is deliberately small relative to the risk, and no historical win rate is ever a guarantee about the future. Both halves of that sentence matter equally.
If it wins 98 percent of the time, why am I not rich in a year?
Because each win pays a small fraction of the amount risked. At one percent risk per trade, the historical suite return was roughly two percent per year. Win rate and return per trade trade off against each other by mathematical necessity. This suite maximises consistency, not growth. Products claiming to maximise both simultaneously are misrepresenting how markets work.
Are the exact entry rules published?
No. The concepts are described openly on this page, the validation methodology is described across this site, and the results are independently computed by TradingView. The precise rules, parameters, and the live tracker are reserved for Golden Circle members. Publishing the full recipe would degrade the very edge members pay to access.
What happens when a Sentinel finally takes a full stop loss?
One loss erases roughly fifteen to twenty small wins. That is the designed cost of the architecture, it is priced into the historical statistics, and members size positions with that day assumed to be coming. A system that has not yet shown you its losing day is not a system without one.
Which markets and timeframe does the suite trade?
Gold, silver, GBPUSD, EURUSD, USDCAD and USDJPY, all on the daily timeframe. Signals generate at the daily close and execute at the next daily open, so the entire suite takes minutes per day to follow and involves no screen watching.
How do I know these numbers were not cherry picked?
Three ways. The headline results come from TradingView’s engine, not our spreadsheets. The validation required profitability in four separate market eras including the brutal 2013 to 2018 gold bear market, on data held out from the design process. And we publish our failures: this same research program has publicly retired systems that looked spectacular in design and died in verification. An operation that only ever reports wins is exactly the kind described in section two.
Get the Sentinel Suite Tracker
All six Sentinels on one chart. Live dashboard, position sizing, trade history, and a single alert that covers every signal. Access is included in the Golden Circle Pro membership together with the full library of validated strategies and the research behind each one.
Join Golden Circle Pro on YouTube →
Follow Sentinel Updates on Telegram →
Choose the Golden Circle Pro tier when you join to unlock tracker access and the full library. Cancel anytime through YouTube. Free Sentinel updates and results posts on the Telegram channel.
Have a question about the Sentinel Suite or membership?
Risk disclaimer: Trading gold, silver, forex, and other financial instruments involves substantial risk of loss and is not suitable for every investor. All win rates, profit factors, and drawdowns quoted in this article are historical results computed from backtesting on TradingView Strategy Tester data and internal simulations; past performance never guarantees future results, the quoted stop losses will eventually be hit, and every trading system experiences losing periods. The AsliGold Sentinel Suite and its tracker are educational and informational tools, not investment advice. You are solely responsible for your own trading decisions, position sizing, and risk management. Always test any system on a demo account before risking real capital. Read the full disclaimer before acting on anything you read here.