A gold chart can look convincing after the move. The harder task is marking useful areas before you know which ones will hold. This guide shows how to approach XAUUSD support and resistance as a small, documented map rather than a collection of lines that gets redrawn until the past looks predictable.
You will work through a fictional chart example, compare a clean map with an overcrowded one, and use a short review exercise. The prices are teaching examples, not today’s gold levels or a tested trading system.
XAUUSD support and resistance are areas, not promises
Support describes an area below or around current price where traders watch for selling to slow or a decline to reverse. Resistance describes an area where an advance may slow or turn. The label depends on price’s position and the context; an area that previously acted as resistance can later be examined as support.
The CME introduction to support and resistance explains common reference points such as previous highs, lows and trend lines. It also treats these as zones rather than exact prices that must hold. This article’s marking routine is an educational exercise, not a claim that a particular pattern has a proven success rate.
A visible turning point is not a direct view of all resting orders. Spot gold and broker CFDs do not give you one complete global order book. A chart can show where that feed traded or quoted; it cannot prove who was buying, how much hidden interest remains, or that institutions must defend your line.
That distinction matters when reviewing a failed level. If price moves through a zone, the useful question is how the observation differs from your original plan. Calling every failure “manipulation” gives you no reproducible rule to improve.
Five checks for marking XAUUSD support and resistance
1. Keep the instrument and feed consistent
Write down the complete symbol and provider. A gold futures chart and an XAUUSD CFD chart represent different products. Even two CFD providers can show different prices or candle boundaries. Do not copy a precise level from one feed and assume it transfers perfectly to another.
Use the same feed for the before-and-after exercise whenever possible. If you compare another chart, label it as a separate reference. Record whether your chart displays bid, ask, midpoint or last-trade information when the platform makes that distinction available.
2. Choose the timeframe before choosing the level
Start with a timeframe relevant to the observation you want to make. A daily zone can provide background for an intraday idea, but it does not specify a five-minute entry. An intraday fluctuation can also occur inside a daily candle that has not closed.
For this lesson, use H4 to mark context and H1 to describe the later reaction. That is a consistent practice format, not a claim that these are the best timeframes. Do not switch timeframes after a failure solely to find a version that makes the original idea look correct.
3. Use a visible reference and a written boundary rule
Identify an obvious past turning area. Decide what your rectangle includes: for example, the extreme wick and a nearby cluster of candle closes. Record the rule so you can use it consistently on the next chart.
A zone width should have a reason tied to the selected candles or a prewritten method. There is no universal number of dollars that fits every XAUUSD support and resistance zone. Widening a rectangle until every later reaction fits makes the exercise impossible to evaluate.
4. Prioritize the areas relevant to current price
For an uncluttered practice chart, keep the nearest relevant area above and below current price, plus one broader context area if needed. Three is a working display limit for this exercise, not a market law.
Write a sentence explaining why each area matters now. A zone far away may be useful background but irrelevant to the session you are reviewing. You can keep older levels in a separate note instead of covering the active chart with them.
5. Define an invalidation observation
Before advancing the chart, specify what would make you stop treating the area as a reversal candidate. An example observation rule could be a closed H1 candle beyond the far boundary followed by continued acceptance outside it. A different tested method may use different conditions.
Keep the observation rule separate from an actual order instruction. Deciding a zone no longer describes the chart is not the same as determining an executable stop price, position size or exit guarantee. Those require their own checks.
Work through a fictional gold chart
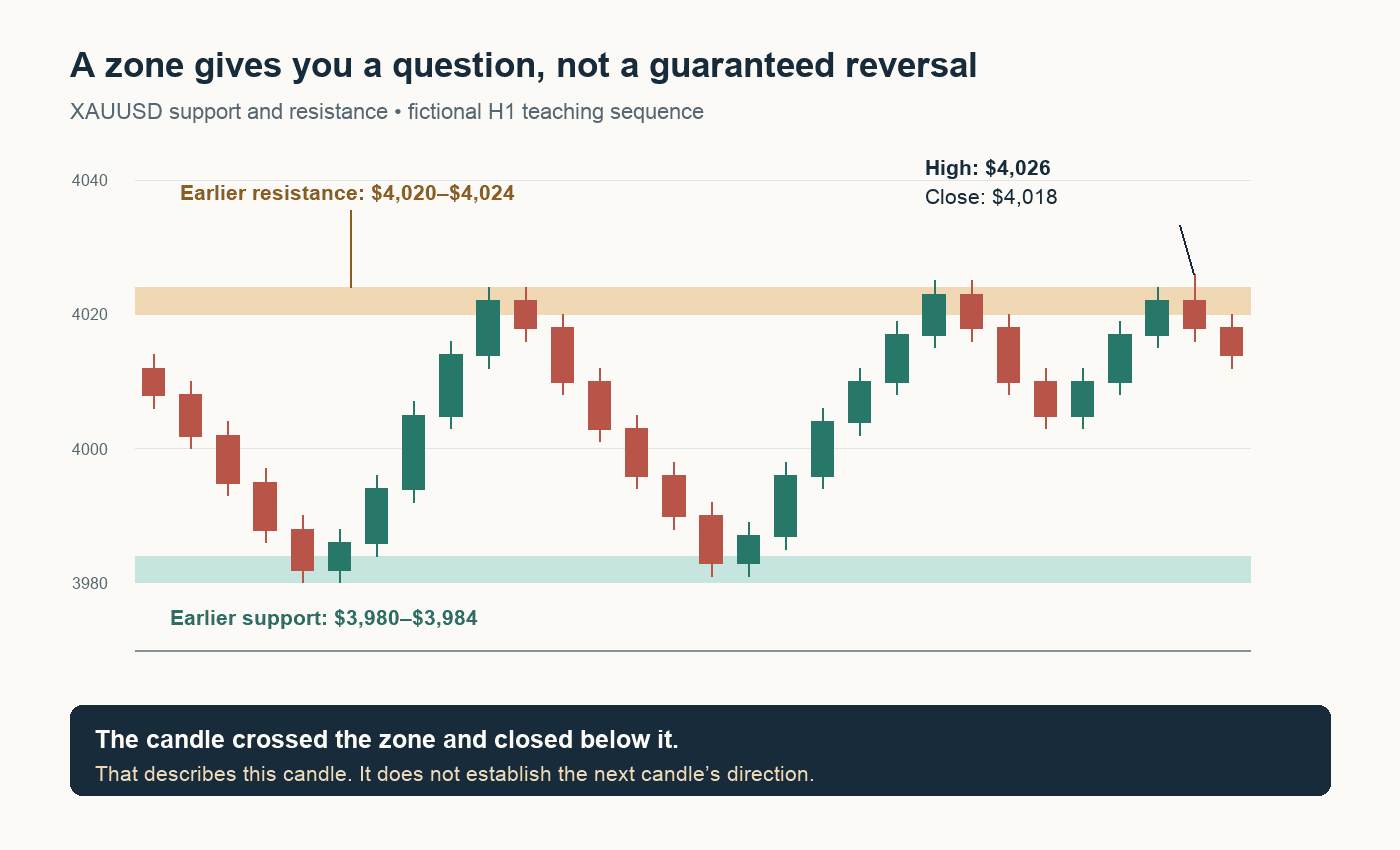
Imagine price previously turned lower from a cluster between $4,020 and $4,024. Later, it trades near $4,005. You mark the earlier area as resistance because it sits above the current price and corresponds to a documented previous reaction.
You also mark a lower area between $3,980 and $3,984, where an earlier decline paused before price moved higher. Your initial map therefore contains two rectangles, their boundaries, the H4 context timeframe and the timestamp of the observation.
| Area | Why it is on the map | What remains unknown |
|---|---|---|
| $4,020–$4,024 | Earlier upper turning cluster | Whether a new approach will reject or break through |
| $3,980–$3,984 | Earlier lower turning cluster | Whether buying will appear on another visit |
| Around $4,005 | Current reference price | Which area, if either, will be reached next |
Now reveal a hypothetical H1 candle with a high of $4,026 and a close at $4,018. It travelled through the upper boundary and finished below the zone. That is evidence of a failed excursion during that candle. It is not evidence that the next candle must fall.
A later candle might continue lower, revisit the same zone or break above it again. Record those outcomes without changing the original rectangle. The value of the exercise is that the definition stays fixed while the observation changes.
A different outcome from the same starting map
Suppose instead that the next H1 candle closes at $4,030 and a later pullback trades into $4,020–$4,024 before closing above it. You now have an example of a break and possible retest. The same original resistance area is being examined from the other side.
Calling it support is a new interpretation based on later evidence. It does not erase the fact that the original resistance failed to hold. Record the transition and the time it became observable so the journal does not make the changed interpretation appear available earlier.
The site’s liquidity-sweep strategy guide explores a more specific failed-break approach. This beginner lesson is about reading and recording the area, before choosing any particular strategy rules.
Review XAUUSD support and resistance without chart clutter
If there is a line every dollar, some line will usually be close to the next turning point. That can create the impression of precision without providing a usable decision process. A smaller set of preselected areas makes failures and ambiguous reactions easier to see.
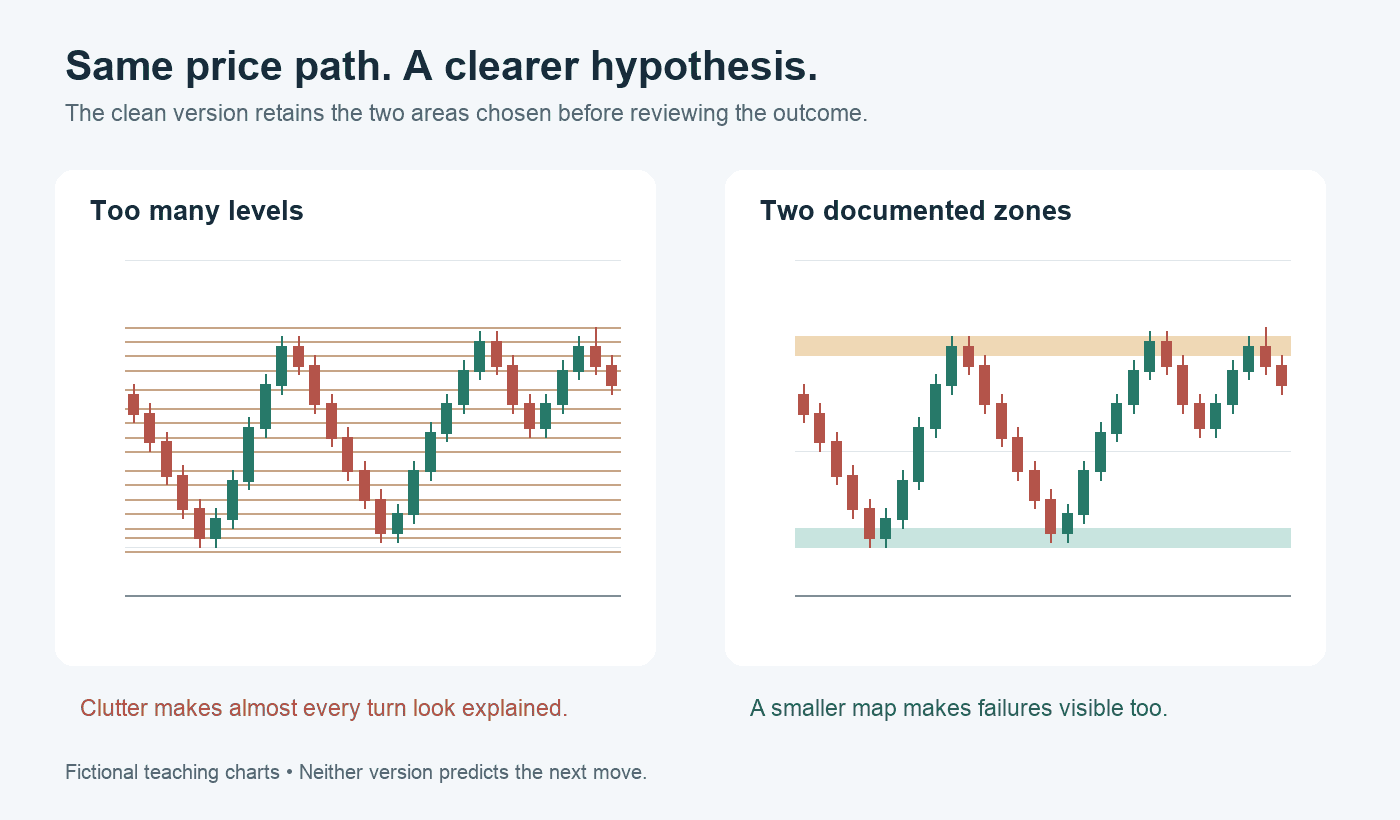
The comparison illustration uses the same fictional price path twice. The crowded version marks many minor fluctuations. The cleaner version retains the two areas selected by the written exercise. Neither chart predicts the future; the cleaner one simply makes the hypothesis easier to inspect.
Do not delete a failed zone from the historical record. Mark it as invalidated, archive the original screenshot and create a new version if the context changes. A dated sequence of imperfect maps teaches more than one polished chart assembled after the full move.
More touches do not create certainty
A repeated reaction can make an area more noticeable. It does not guarantee that the next visit will behave the same way. The market context, participants and price path can change between tests.
For a review, record the number of separate visits using a consistent definition. Several candles sitting inside one zone may be one extended visit rather than many independent confirmations. Avoid inflating the count by treating every small fluctuation as a new test.
Practise XAUUSD support and resistance without hindsight
Choose a historical point and hide the later candles with a replay feature or by moving the chart’s visible window. Mark the zones using only the information available at that point. Save the initial map before advancing.
Then reveal one candle at a time. Describe the observation before interpreting it: “high beyond the upper boundary, close inside the zone” is more precise than “smart money trapped buyers.” Keep observations that do not fit a neat pattern.
Repeat on a set of observations selected before seeing their outcomes. If you choose only charts with clean reactions, the exercise will overstate how clear real-time decisions are. Keep a category for “unclear” rather than forcing every example into success or failure.
A practice log might record the first approach, deepest excursion into the zone, close location and later outcome over a fixed number of candles. Decide that observation window in advance. Changing it until the desired reversal eventually appears makes different examples incomparable.
Turn the replay into a useful observation log
A screenshot records appearance; a short log records the decision you could actually have made at the time. For each XAUUSD support and resistance review, write the observation timestamp, the two zone boundaries and the next six closed H1 candles as a fixed review window. Six is an example research choice, not a recommended holding period. Use the same window across this small practice set.
Separate three questions in the record
First, did price reach the selected area during the window? If it did not, record “not reached.” Do not count that as a successful rejection simply because price stayed below resistance. Second, what happened during the first visit: a close below, inside or above the zone? Third, what happened by the end of the window? These observations answer different questions and should occupy separate columns.
For example, the first visit might close back below resistance, but the final candle might finish above it. Both statements can be true. Calling the example a winner because it briefly moved down hides the later outcome. Calling it a loser assumes an entry and exit that the chart-marking exercise never specified. The log should preserve the actual sequence before attaching any strategy label.
Record distance without pretending it is profit
Suppose a fictional candle closes at $4,018 after the excursion described earlier, and the lowest subsequent quote in the review window is $4,008. The difference is $10 per ounce on that chart. It is not automatically a $10 trading profit: there was no defined executable entry, volume, exit instruction or cost allowance. A trader may also have encountered an adverse move before the lower price appeared.
If you later test a complete strategy, record both favorable and adverse movement using a consistent entry reference. Include spread, commission and a realistic execution assumption. Do not transform the best visible future price into an exit that your written rules could not have selected. This keeps the learning exercise separate from an unsupported performance claim.
Investigate disagreements before changing the method
If two people mark different zones on the same chart, compare their reference candles and boundary rules first. One may be using the full wick range while the other uses a cluster of closes. Ask each person to apply the same rule to a second unseen example. A rule that can be repeated is easier to examine than a rectangle justified only by how well it fitted the first chart.
At the end of a practice set, sort the records into clear reactions, breaks, ambiguous visits and areas never reached. Note where the method produced frequent ambiguity. That may indicate an unclear definition, an overly wide zone or simply a market condition that the exercise does not describe well. It is a reason to refine the next practice set, not to rewrite the earlier results.
Keep any revised XAUUSD support and resistance rules in a new version of the log. Compare them on fresh examples so the same historical candles do not serve as both the source of the rule and its supposed proof. A small practice set can improve consistency; it cannot establish a reliable success rate or guarantee future outcomes.
Connect the chart to the rest of the process
XAUUSD support and resistance provide context, but they do not answer the money question. Once a separate method defines an entry and invalidation, use the actual contract specification and volume to estimate exposure. The gold profit and loss tool helps explain the price arithmetic.
For a different type of chart behaviour, compare the H1 pullback guide. A trend retracement and a range reversal can look similar over a few candles, but they depend on different context and rules.
Return to the price action learning guide for the wider sequence: chart structure, market context, risk, tools and execution. An indicator or community idea should fit into that process rather than replace it.
XAUUSD support and resistance questions
Should I use candle bodies or wicks?
They describe different parts of the price range. Choose a consistent boundary rule and record it. This exercise uses a visible extreme and nearby closes; it does not claim that one universal body-or-wick rule is best.
How wide should a gold zone be?
Its width should follow the selected reference and your written method. A fixed dollar width is not suitable for every timeframe or market condition. Do not expand it after the event solely to capture a reaction.
Does a wick through resistance prove a liquidity sweep?
No. It describes an excursion beyond the area. Later price behaviour and the precise definition of the method still matter, and the chart does not reveal every underlying order.
Can I trade every support touch?
A touch alone does not define a complete trade plan. Entry conditions, invalidation, exposure, costs and execution must be considered separately. This lesson does not recommend automatic entries.
Why do my levels differ from someone else’s?
Different feeds, timeframes, candle boundaries and marking rules can produce different areas. Compare those assumptions before deciding one chart is wrong.