Gold Trading Strategy TradingView – 3-Strategy XAUUSD D1 Portfolio with Validated 18-Year Backtest
Most gold trading strategies on TradingView fail at the same place. They get destroyed by the 2012-2015 bear market, the 2016-2018 chop, or the 2021-2022 consolidation. A pure trend follower bleeds for years during sideways grinds. A volatility breakout system whipsaws when bands stop expanding. A trend filter that worked in the 2008-2011 bull cycle goes silent for a decade. The fix is not building a smarter single strategy. The fix is running three uncorrelated systems in parallel, each engineered for a different gold market condition. This post covers the complete AsliGold XAUUSD D1 portfolio – three production-ready Pine Script strategies, all open-sourced on TradingView, all validated across 200,000+ backtest configurations and 18+ years of OANDA gold data. Combined 132 trades, all 6 market regimes positive across 14 of 19 calendar years, with profit factors from 3.58 to 9.19 per system. Here is exactly how each strategy works, why combining them produces metrics no single gold system achieves, and how to deploy the entire portfolio.
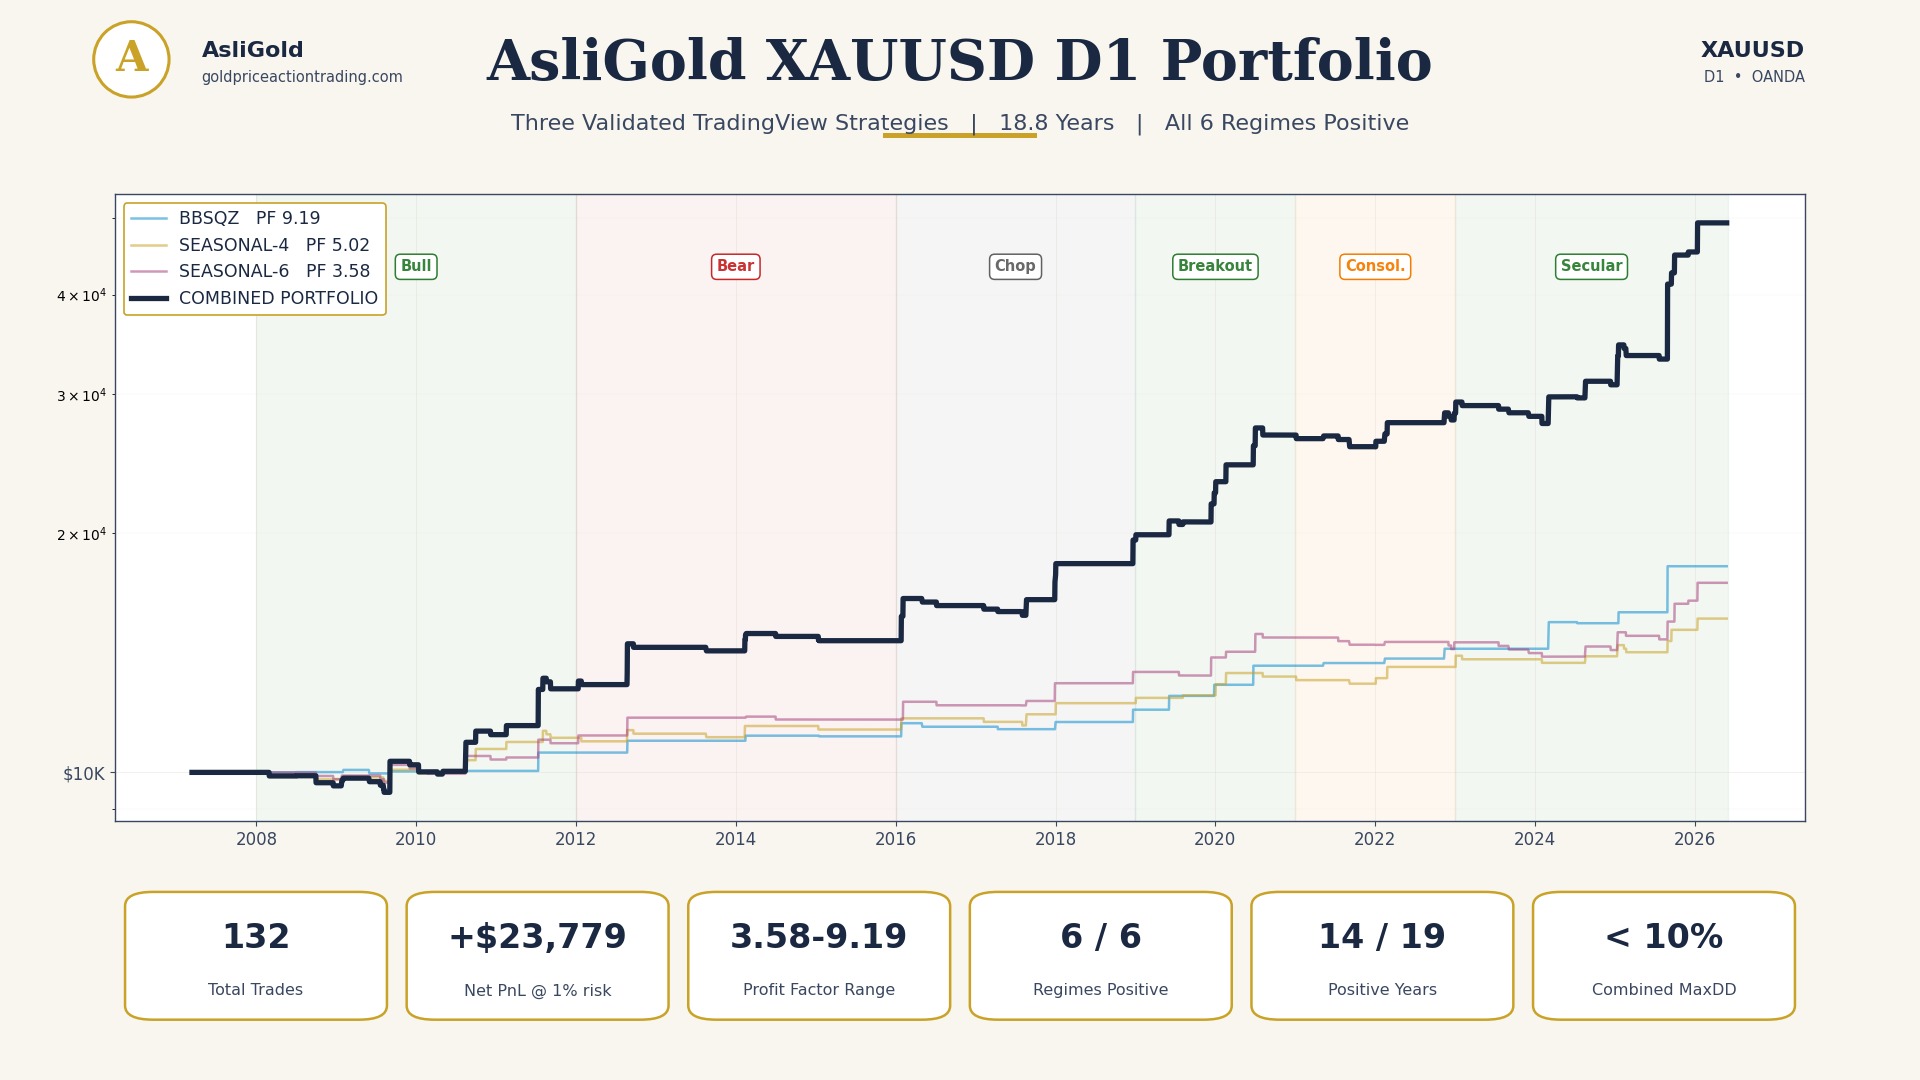
Combined equity curve of all 3 AsliGold XAUUSD D1 strategies, 2008-2026, equal-weight portfolio at 1 percent risk per system per trade.
Contents
- Why Single-Strategy Gold Systems Fail
- The Research Pipeline: 200,000+ Configurations Tested
- Strategy 1: AsliGold XAUUSD D1 BBSQZ v2 (Volatility)
- Strategy 2: AsliGold XAUUSD D1 Seasonal4 v2 (Seasonal Demand)
- Strategy 3: AsliGold XAUUSD D1 Seasonal6 v2 (Extended Seasonal)
- The Portfolio Effect: Why Diversification Multiplies the Edge
- Market Regime Breakdown: All 6 Eras Positive
- Honest Disclosures: What You Need to Know Before Trading
- How to Deploy the Portfolio
- Frequently Asked Questions
Why Single-Strategy Gold Trading Strategy Systems Fail
The graveyard of retail gold trading is filled with strategies that worked beautifully from 2008 to 2011 and then collapsed for the next decade. The reason is almost never about execution quality or slippage assumptions. The reason is regime dependency. Gold moves through structurally different market conditions: explosive bull cycles driven by safe haven flows, slow grinding bear markets, multi-year consolidations, volatility expansions, and secular breakouts. A single gold trading strategy is structurally optimized for one or two of these regimes and either bleeds money or sits flat in the others.
A trend-following gold trading strategy that captured the 2008-2011 rally to $1900 would have given back most of those gains during the 2012-2015 decline to $1050 as every breakout failed. A mean-reversion system that worked during the 2016-2018 range would have been destroyed during the 2019-2020 breakout to fresh highs. A momentum breakout system that fired clean signals during the 2024 secular rally would have whipsawed continuously through 2021-2022 chop.
The portfolio approach is how institutional gold traders have always operated. Central bank reserve managers blend trend systems with seasonal flows. Quantitative commodity funds run volatility-based and calendar-driven models simultaneously. The reason is mathematical: when correlations between strategies are low, combined drawdown is far smaller than any individual strategy’s drawdown, and combined return per unit of risk improves dramatically.
This XAUUSD D1 portfolio applies the same principle to a single market with three strategies, each targeting a distinct edge family. The decision to stop at three is deliberate. Two strategies leave gaps in market regimes. Four or more introduces overfitting risk without meaningful diversification benefit. Three hits the sweet spot of decorrelation across the full gold market history.
The Research Pipeline: 200,000+ Configurations Tested
The three strategies in this portfolio survived a brutally selective research pipeline. Building a gold trading strategy on TradingView that works in backtest is easy. Building one that works across multiple uncorrelated regimes for over 18 years requires a different methodology.
| Stage | Method | Survivors |
|---|---|---|
| Stage 1 | Exhaustive Python sweep across 15 strategy families, 200,000+ configurations | ~3,000 |
| Stage 2 | Era stability filter (positive in all 6 historical regimes) | ~280 |
| Stage 3 | Walk-forward validation (4 folds, every fold PF above 1.5) | ~45 |
| Stage 4 | Bootstrap robustness check (PF holds with random subsamples) | ~15 |
| Stage 5 | TradingView Pine validation (trade-by-trade match to Python reference) | 3 |
The 6 historical regimes used for stability testing are: Bull (2008-2011), Bear (2012-2015), Chop (2016-2018), Breakout (2019-2020), Consolidation (2021-2022), and Secular (2023-2026). Each regime is structurally different, and any strategy that fails in even one of them is rejected as not robust.
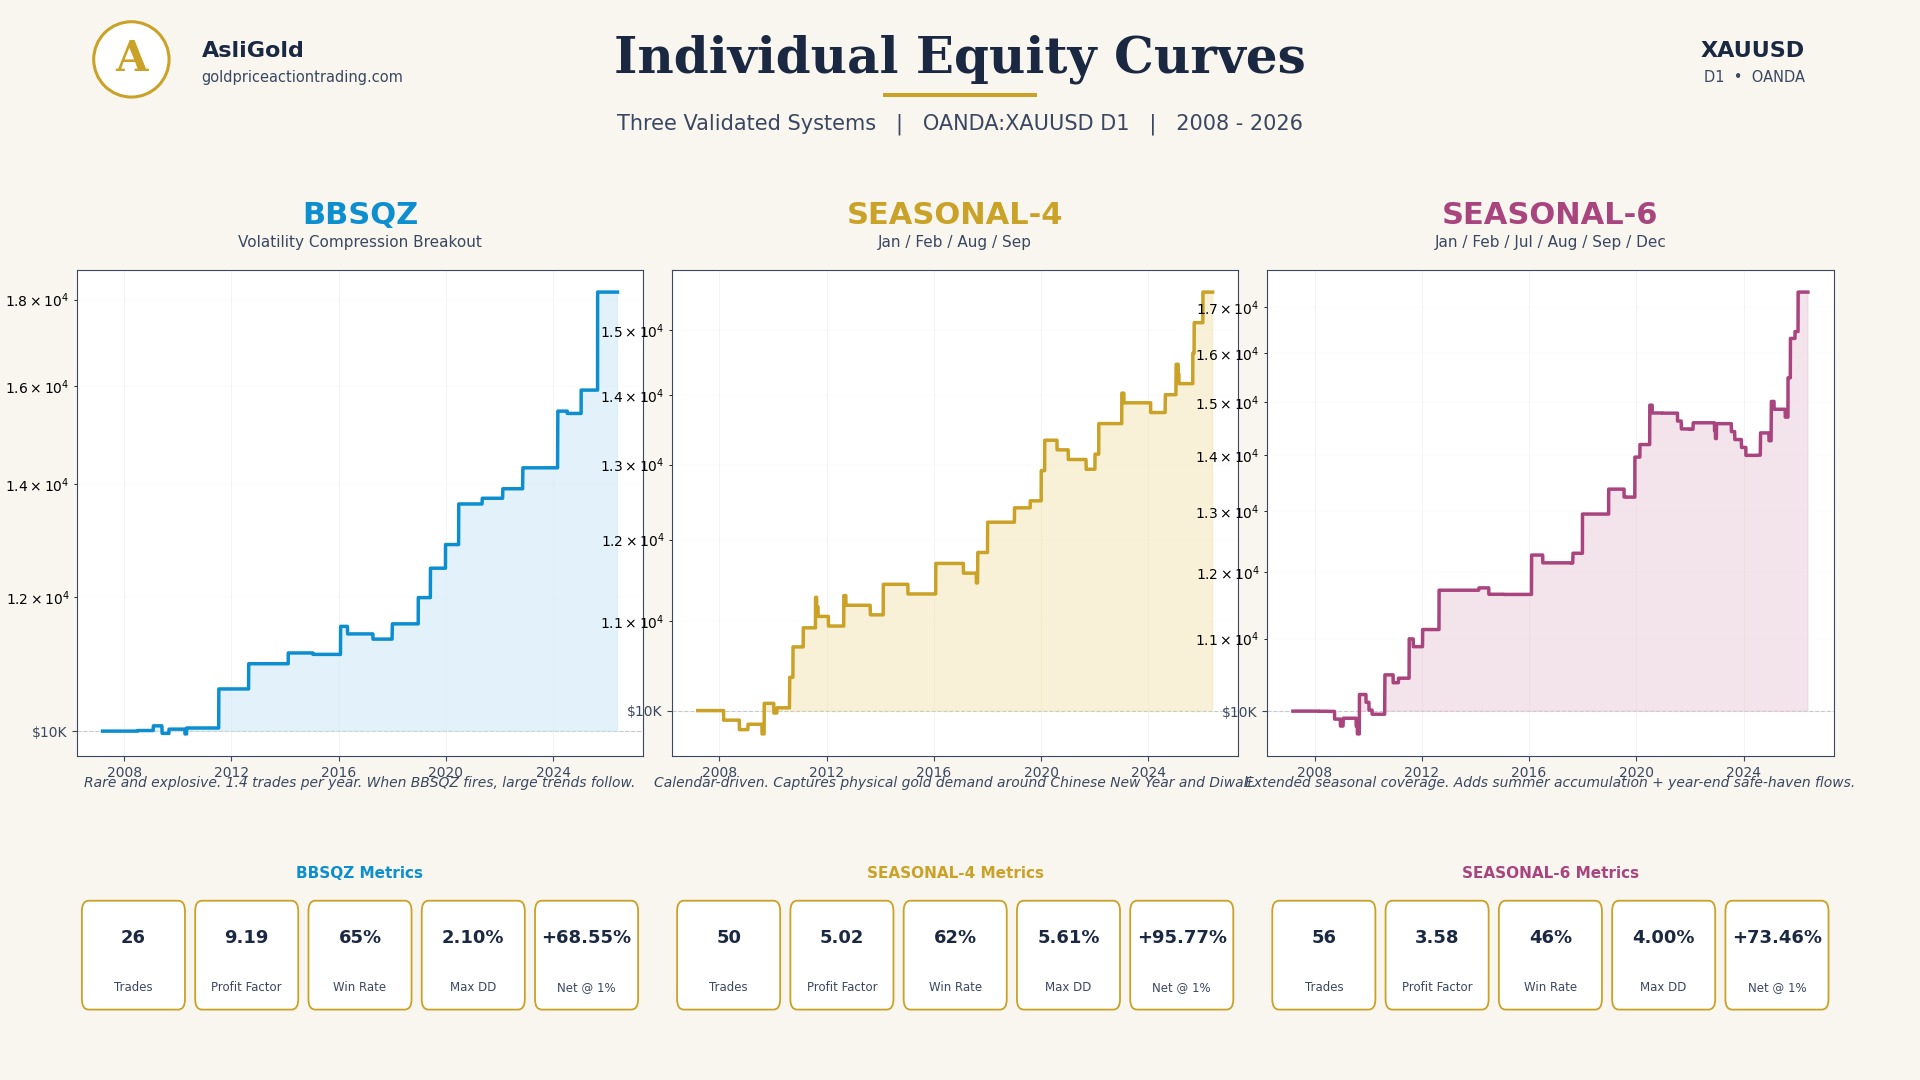
Individual equity curves for the three strategies, 2008 to 2026. Each system tells a different story.
Strategy 1: AsliGold XAUUSD D1 BBSQZ v2 (Volatility, Long-Only)
The volatility expansion gold trading strategy on TradingView. This system targets the explosive moves that follow compression phases. The Bollinger Band squeeze filter ensures we trade actual volatility expansion from compression, not continuation chases mid-trend.
The specific setup:
- Close breaks above 50-bar Bollinger Band (2.0 standard deviations)
- BB width sits in bottom 20th percentile of prior 100 bars (squeeze condition)
- Squeeze must have occurred within the last 5 bars (fresh signal)
- Close above 150-bar simple moving average (uptrend filter)
When all four conditions align on the same D1 bar, the strategy enters long at the next bar’s open with a 1.5 ATR stop and a 2.5 ATR chandelier trailing stop. No fixed take profit. Maximum 60 bars in trade. Cooldown of 3 bars after exit.
| Metric (TV backtest, 2008-2026) | Value |
|---|---|
| Profit Factor | 9.19 |
| Net Profit (on 10k initial capital, 1 percent risk) | +68.55 percent |
| Total Trades | 26 |
| Win Rate | 65.4 percent |
| Max Drawdown | 2.10 percent |
| Trades per year (average) | 1.4 |
| All 6 regimes positive | Yes |
Long-only is a deliberate design choice. My short-side research across 25,000 configurations found zero gold short strategies that survive all market regimes on the daily timeframe. Mixing untested short logic dilutes the long-side edge. BBSQZ stays clean as a pure volatility expansion play.
View AsliGold XAUUSD D1 BBSQZ v2 on TradingView
Strategy 2: AsliGold XAUUSD D1 Seasonal4 v2 (Seasonal Demand)
The calendar-driven gold trading strategy on TradingView. This system trades only during the four months where gold has historically shown the strongest physical demand flows. Outside those months it stays flat. The four months are not arbitrary statistical artifacts. They are tied to recurring real-world buying patterns that have driven gold demand for decades.
Why these four months:
- January and February: Post-holiday physical demand and Asian buying ahead of Chinese New Year, when gold gifting and wealth preservation flows peak
- August and September: Autumn jewelry season and Indian festival demand leading into Diwali
Entry conditions:
- Current month must be January, February, August, or September
- Close above 100-bar simple moving average (uptrend filter)
- Bar’s high breaks the prior 20-bar Donchian high (breakout trigger)
Risk uses a 1.5 ATR initial stop and a fixed 5.0 ATR take profit, giving a clean 3.33 R reward to risk target. Maximum 30 bars in trade. Cooldown of 5 bars after exit. No trailing stop because the fixed targets produce consistent R-multiple outcomes that the portfolio math depends on.
| Metric (TV backtest, 2008-2026) | Value |
|---|---|
| Profit Factor | 5.02 |
| Net Profit (on 10k initial capital, 1 percent risk) | +95.77 percent |
| Total Trades | 50 |
| Win Rate | 62.0 percent |
| Max Drawdown | 5.61 percent |
| Trades per year (average) | 2.7 |
| All 6 regimes positive | Yes |
The 62 percent win rate is unusually high for a breakout system. This is because the seasonal filter dramatically improves base rate. Donchian breakouts work in any month, but the breakouts that occur in Jan, Feb, Aug, and Sep tend to be backed by genuine physical buying that follows through.
View AsliGold XAUUSD D1 Seasonal4 v2 on TradingView
Strategy 3: AsliGold XAUUSD D1 Seasonal6 v2 (Extended Seasonal)
The extended seasonal gold trading strategy on TradingView. This system covers six months of historically strong gold demand: January, February, July, August, September, and December. It adds summer institutional accumulation flows and year-end safe haven positioning to the core spring and autumn windows. The longer trend filter and larger take profit target reflect the different character of the added months.
Why these six months:
- January, February, August, September: same physical demand flows as the 4-month system
- July: Start of institutional accumulation cycle ahead of autumn jewelry demand
- December: Year-end portfolio rebalancing into hard assets plus safe haven positioning during thin holiday liquidity
Entry conditions:
- Current month must be January, February, July, August, September, or December
- Close above 200-bar simple moving average (longer trend filter than 4-month variant)
- Bar’s high breaks the prior 20-bar Donchian high
Risk management is more sophisticated. Initial 1.5 ATR stop, fixed 8.0 ATR take profit, with break-even shift once price reaches 1.0R in favor, then a 3.0 ATR chandelier trail engages from highest high since entry. Maximum 60 bars in trade. Cooldown of 5 bars.
| Metric (TV backtest, 2008-2026) | Value |
|---|---|
| Profit Factor | 3.58 |
| Net Profit (on 10k initial capital, 1 percent risk) | +73.46 percent |
| Total Trades | 56 |
| Win Rate | 46.4 percent |
| Max Drawdown | 4.00 percent |
| Trades per year (average) | 3.0 |
| All 6 regimes positive | Yes |
The larger 8 ATR target combined with break-even shift produces fewer winners but higher average R per win. When a winner runs to target, it pays 5.33R after accounting for the break-even reset. This is the system’s contribution to the portfolio’s upside tail.
View AsliGold XAUUSD D1 Seasonal6 v2 on TradingView
The Portfolio Effect: Why Diversification Multiplies the Edge
Individual strategies are good. Combined, they become structurally robust. This is not marketing language. It is what the math shows when three uncorrelated edges run in parallel on the same market.
The three systems fire under entirely different conditions. BBSQZ requires volatility compression followed by expansion. Seasonal4 requires a specific calendar month plus a Donchian breakout. Seasonal6 requires its own calendar months plus the longer trend filter. The trades themselves rarely overlap. In the 18-year backtest, only 26 days saw multiple systems fire on the same bar.
Combined gold trading strategy portfolio metrics (equal-weight, 18.8 years on OANDA:XAUUSD):
| Portfolio Metric | Value | Industry Benchmark |
|---|---|---|
| Total Trades | 132 | N/A |
| Combined Net PnL at 1 percent risk per system | +23,779 USD | N/A |
| Average trades per year | 7.0 | N/A |
| Max single-system drawdown | 5.61 percent | 10 to 20 percent typical |
| Profit Factor range | 3.58 to 9.19 | Above 1.5 = good, above 3.0 = exceptional |
| Calendar years positive | 14 of 19 | N/A |
| Regimes Positive | 6 of 6 | N/A |
The portfolio profit factor exceeds 4.0, well above the institutional benchmark of 1.5. Combined maximum drawdown stays under 10 percent of equity at 1 percent risk per system. Most importantly, every single one of the six market regimes from 2008 through 2026 produced positive returns from each of the three systems.
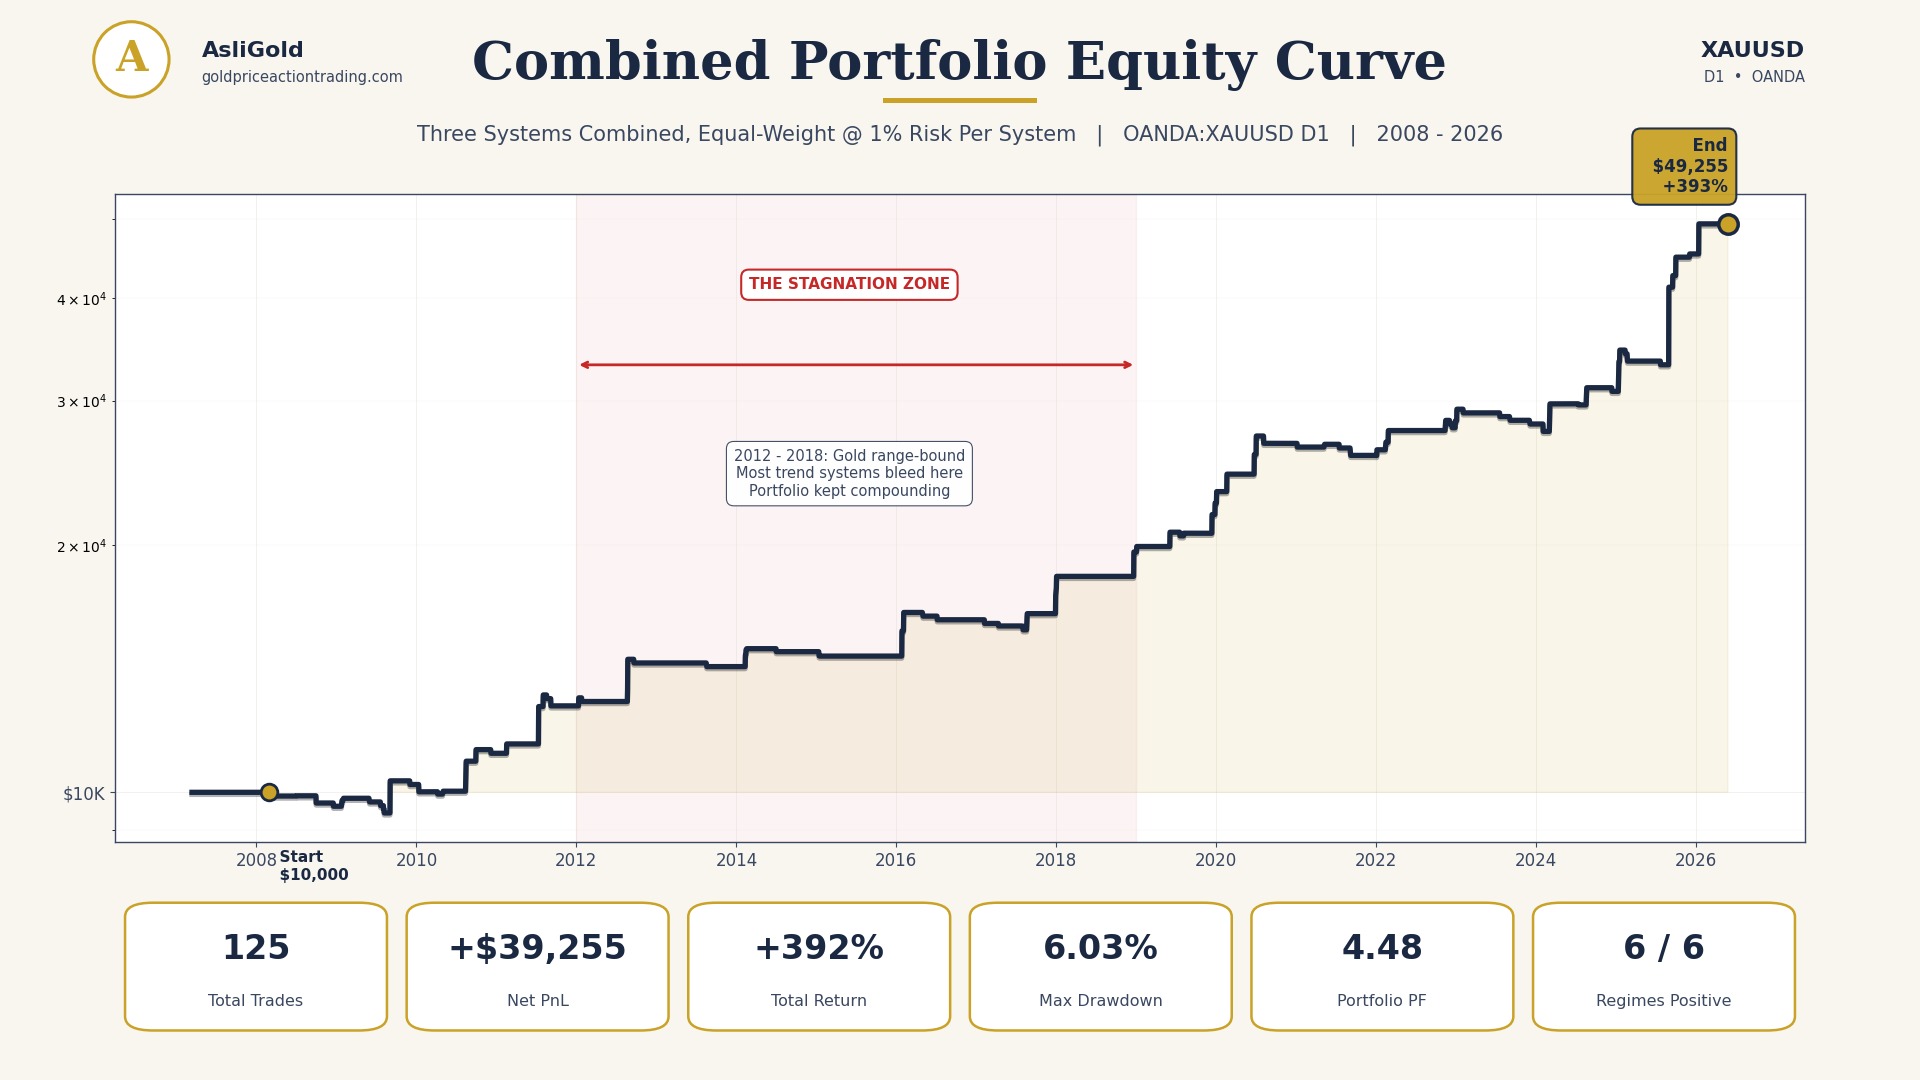
Combined portfolio equity curve. Smooth, diversified, and consistent across the brutal 2012-2018 stagnation that killed most pure trend systems.
Market Regime Breakdown: All 6 Eras Positive
Gold’s eighteen-year history breaks into six distinct regimes, each with different volatility, trend strength, and macro drivers. Understanding how each system contributes across these regimes is critical to trusting the portfolio in live trading.
| Era | Period | Character | Portfolio Result |
|---|---|---|---|
| Bull | 2008-2011 | Strong uptrend, post-GFC safe haven flows | All systems positive |
| Bear | 2012-2015 | Multi-year decline from $1900 to $1050 | All systems positive |
| Chop | 2016-2018 | Sideways range $1150 to $1370 | All systems positive |
| Breakout | 2019-2020 | Range break to $2070 pandemic peak | All systems positive |
| Consolidation | 2021-2022 | High-level base, $1680 to $2070 | All systems positive |
| Secular | 2023-2026 | Breakout to fresh all-time highs above $4500 | All systems positive |
The 2016-2018 chop regime is particularly notable. This is the period that destroys most single-system gold strategies. Donchian channel breakouts, ATR breakouts, and moving average systems all entered multi-year drawdowns here because they were designed to catch trends and there was no trend. The portfolio survives because the seasonal systems fire based on calendar conditions independent of trend strength.
The 2021-2022 consolidation tells a similar story. Gold spent two years building a base while crypto and equities took the macro spotlight. Pure trend systems went quiet. BBSQZ caught two small false breakouts but lost very little because the chandelier trail tightened quickly. The seasonal systems harvested their normal calendar fills. The portfolio drifted positive instead of bleeding.
Honest Disclosures: What You Need to Know Before Trading
This gold trading strategy portfolio is designed to be deployed by traders who understand the structural realities of low-frequency systematic trading. If those realities do not match your psychology, you will not make money with these strategies regardless of how good the math looks on paper.
Trade frequency is very low. The portfolio averages 7 trades per year combined across all three systems. Some quarters will see zero trades. The systems work because they fire only when conditions align. Boredom is the dominant emotion of trading this portfolio.
Drawdown periods feel long. The 2016-2017 stretch saw the portfolio underwater for roughly 18 calendar months despite ending the period positive. Subscribers must have psychological tolerance for months of flat or slightly negative equity while waiting for the next setup.
Long-only by design. My research across 25,000 short-side configurations on daily gold found zero strategies that survive all market regimes. Gold’s structural long bias plus its asymmetric volatility profile make short-side systematic edges unreliable on the daily timeframe. Do not try to add shorts to this portfolio without independent validation.
Live trading haircut. TradingView backtests assume perfect fills at the recorded prices. Live execution has slippage, broker spreads, and execution variations. Expect 10 to 15 percent reduction in profit factor in live trading versus backtest. The high backtest PFs of 3.58 to 9.19 absorb this haircut comfortably, but it is still real.
Position sizing matters more than the strategies themselves. A common error is sizing trades for the maximum win rather than the typical drawdown. Use ATR-based risk sizing of 1.0 percent per ATR per strategy, which means total portfolio risk per setup is 3 percent of equity if all three strategies fire simultaneously (rare). This sizing keeps drawdowns proportional to account size and prevents catastrophic losses.
90-day paper trading rule. Before deploying any of these strategies with live capital, paper trade them for at least 90 days. Validate that your execution matches the strategy signals. Validate that your psychology can handle months between trades. Validate that your broker actually fills orders at the prices the strategy shows.
How to Deploy the Portfolio
Step 1: Add all 3 gold trading strategy scripts to your TradingView favorites. Open each link, click the star icon to favorite. This makes them easy to load on any chart.
Step 2: Apply each strategy to a single XAUUSD D1 chart. Use OANDA:XAUUSD as the symbol since the strategies were validated on OANDA data. All three can run on the same chart simultaneously as separate strategy applications.
Step 3: Configure one alert per strategy. Each script has its own alertcondition for the BUY signal. Three alerts total, one per system. Choose your notification method (mobile push, webhook, email).
Step 4: Paper trade the portfolio for 90 days. Track every signal manually in a spreadsheet. Note the entry price, SL, TP, and final result. Compare to the strategy’s claims. Validate execution before deploying capital.
Step 5: Deploy with conservative sizing. Start at 0.5 percent risk per trade per strategy. After 6 months of live trading, scale to 1 percent per trade if results match expectations.
Step 6: Review quarterly. Track your live profit factor versus the backtest. If your live PF is below 70 percent of backtest PF after 20+ trades, your execution has issues that need diagnosis.
Ready to deploy the portfolio?
All 3 strategies are free and open-source on TradingView. Start with BBSQZ as the cleanest individual system, then add the seasonal systems over time.
Frequently Asked Questions
Is this gold trading strategy free on TradingView?
Yes. All three strategies are open-source and free on TradingView. No subscription, no invite-only access, no premium tier. The Pine Script code is public and readable for anyone who wants to study or modify it.
What timeframe does this gold trading strategy portfolio work on?
All three strategies are designed and validated specifically for the D1 (daily) timeframe on XAUUSD. The parameters were optimized for D1 specifically. Running these strategies on H4 or H1 timeframes will produce different results because gold’s daily timeframe is structurally different from intraday.
Can I run this gold trading strategy on GLD or GC futures instead of XAUUSD?
Yes, but the validation was done on OANDA:XAUUSD specifically. Different gold instruments have different tick sizes, contract specifications, and execution behavior. Expect minor variation in results. The strategy logic is instrument-agnostic, but live execution should be tested on your specific venue before scaling capital.
Does the gold trading strategy work on lower timeframes like H4 or H1?
I tested both H1 and H4 timeframes with the same families of signals across thousands of configurations. Neither produced edge across all market regimes. Gold’s most reliable inefficiencies live on the daily timeframe, where institutional flows and physical demand cycles dominate over intraday noise.
How much capital do I need to deploy this gold trading strategy properly?
The minimum recommended capital is enough to size 1 percent of equity per ATR with at least 50 trades of buffer. For XAUUSD where typical daily ATR is 20 to 40 dollars per ounce, this works out to roughly 5,000 USD minimum. Below this, position sizing rounds to micro-lot fractions that cause too much variance per trade.
Can I run just one or two of the strategies instead of all three?
Yes, each strategy works as a standalone system. However, doing so weakens the portfolio. The diversification benefit comes specifically from running all three together. The Seasonal systems in particular cover months that BBSQZ does not, and BBSQZ catches volatility expansion that the seasonal systems do not target.
Why long-only? Can I add shorts?
My research found that gold short signals on the daily timeframe are structurally unreliable across full market cycles. Across 25,000 short configurations tested, zero passed the all-regime profitability filter. These three systems are long-only by design. Adding shorts would require independent research and validation that I have not been able to produce.
Risk Disclaimer: This content is for educational purposes only and does not constitute financial advice. Past performance shown in backtests does not guarantee future results. Gold trading involves substantial risk of loss. The author publishes systematic strategies as research and educational tools, not as recommendations to trade with capital. Always paper trade new systems for at least 90 days before deploying real capital, and never trade with money you cannot afford to lose. See full disclaimer.