Price action lab · Gold and Bitcoin examples
The order block vs fair value gap question is easiest to answer by drawing the two zones on the same move. An order block is a selected candle or area before a displacement under a stated method. A fair value gap is a three-candle relationship whose outer candles leave a price interval between their ranges. The rectangles can overlap, sit apart or fail independently.
Contents
Order block vs fair value gap: define the boundaries first
These terms are widely used in smart-money-concept education, but individual teachers and indicators do not always implement them identically. An order block may use a candle body, its full high-to-low range or a more elaborate selection rule. Some methods require a specific structure break; others add displacement, session or volatility filters.
For this lesson, a bullish order-block candidate is the body of the last bearish candle immediately before an upward displacement that closes beyond the nearby earlier high. This is a transparent teaching convention, not a universal definition. A bearish version reverses the directions. The selected candle cannot be called a complete trade just because it is coloured differently from the next one.
For a bullish fair value gap, compare the first candle’s high with the third candle’s low around a strong middle candle. If the third low is above the first high, the interval between them is the zone used here. For a bearish version, the third high is below the first low. Wait until the third candle closes before treating its final high or low as known.
The zazenio indicator description on TradingView is one example of an author explicitly defining displacement filters, order-block selection and mitigation rules. It illustrates why settings matter; it is not an endorsement of that script or proof that its zones predict returns.
Read the fictional gold example step by step
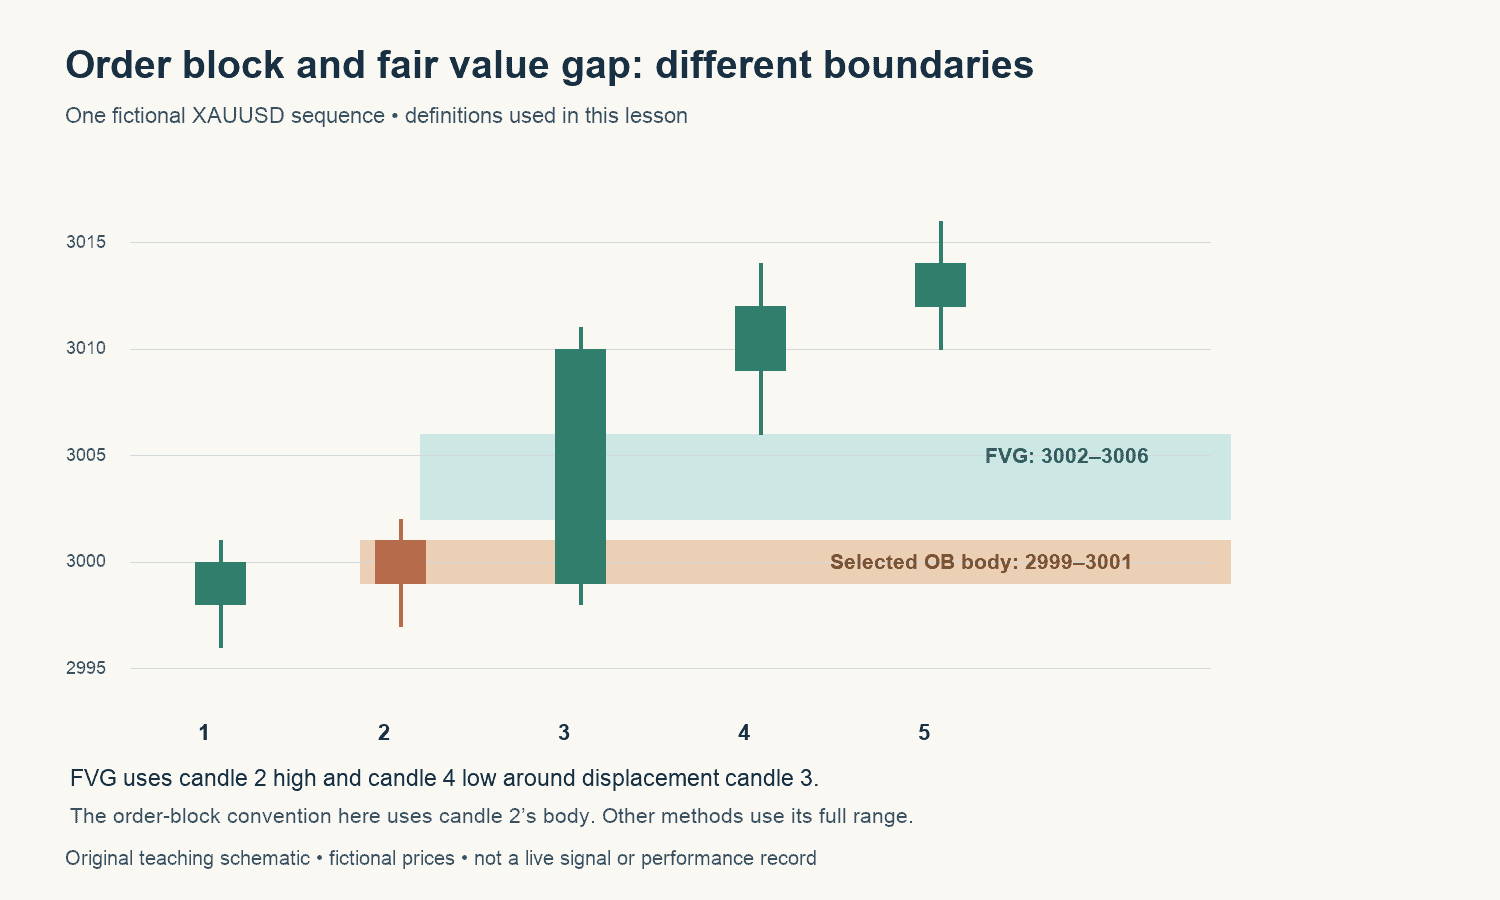
The chart numbers five candles so the exact references are easy to identify. Candle 2 opens at 3,001 and closes at 2,999, with a high of 3,002 and a low of 2,997. Under the body-based convention, its candidate zone is 2,999–3,001. A full-range convention would instead draw 2,997–3,002. That is already a meaningful difference before any later price action occurs.
Candle 3 provides the upward displacement. Candle 4 then has a low of 3,006. Comparing candle 2’s high of 3,002 with candle 4’s low of 3,006 creates the three-candle fair value gap at 3,002–3,006. The candle numbers in the full chart are 2, 3 and 4; they play the first, middle and third roles in this particular pattern.
| Feature | Boundary in the example | How it was selected |
|---|---|---|
| Order-block body | 2,999–3,001 | Open and close of candle 2 |
| Alternative full-candle zone | 2,997–3,002 | Low and high of candle 2 |
| Fair value gap | 3,002–3,006 | Candle 2 high to candle 4 low |
| Information available | After candle 4 closes | The completed outer-candle relationship |
The gap is not proof that no trading occurred between 3,002 and 3,006. The middle candle moved through that area. The label describes limited overlap between the two outer candle ranges. Treating it as a literal empty order book would claim information that an ordinary OHLC chart does not provide.
Now imagine price retraces from above. It could enter the gap and turn without reaching the order-block body. It could pass through the gap and react deeper. It could cross both areas and continue lower. The fact that two zones came from the same move does not force them to behave the same way on a revisit.
Apply the distinction to a Bitcoin chart
Use a separate fictional BTC example to check that you understand the geometry rather than memorizing gold numbers. Suppose the first candle’s high is 60,100 and the third candle’s low is 60,300. The bullish fair value gap is 60,100–60,300 under the same outer-candle rule.
If the selected earlier bearish candle opens at 60,050 and closes at 59,950, its body-based order block is 59,950–60,050. Its full wick range could be wider. The gap and the body zone are separated; combining them into one large rectangle would change the definition and the potential entry-to-invalidation distance.
Bitcoin adds a feed question. A spot exchange, a perpetual contract and a broker CFD may produce different highs, lows and spreads. State the venue, product, quote currency and timeframe when sharing a chart. A gap visible on one feed may be absent or slightly different on another.
The same pattern name also does not imply the same financial exposure. A $100 Bitcoin move and a $1 gold move need to be translated through their actual contract quantities. The Bitcoin 30-minute strategy guide is a separate method to study; do not silently add these zones to its rules and assume that earlier test results still apply.
Five checks before you use either zone
1. Fix the chart context
Record the instrument, feed, timeframe and completed candles. A five-minute zone inside a daily range answers a different question from a daily zone at a multi-week turning area. Use the price action learning guide to connect the pattern with the broader structure.
2. Name the exact selection rule
Write whether the order block uses the body or full candle, which earlier high or low must break, and what counts as displacement. For the gap, record the two boundary prices and the confirmation candle. A repeatable rule should let another reader reproduce the same rectangle.
3. Separate a touch from an entry
Price arriving at a zone is an observation. A limit entry, a candle-close confirmation and a later structure break are different execution methods. Each creates different timing and risk. Do not count whichever one worked best after seeing the result.
4. Define invalidation and expiry
Some methods retire a zone after a touch; others require a close through it or use a midpoint condition. A zone can also become irrelevant as the surrounding structure changes. Decide this before reviewing the outcome. The order block vs fair value gap comparison is incomplete without these lifecycle rules.
5. Check exposure and costs
A narrow-looking zone does not establish low monetary risk. Calculate from the actual available entry, protective distance, volume and contract. Include spread, commissions and potential slippage. If a small change in execution removes the apparent reward, the chart needs more than a persuasive label.
Find the completed patternDefine
Write the boundary ruleObserve
Record the revisit or non-visitReview
Keep failures and inactive cases
What failure looks like
A bullish zone can be crossed without any useful rebound. It can produce a small reaction that is insufficient after costs. It can look attractive on a historical screenshot but only become identifiable after much of the move has already occurred. These are different failure modes and should be recorded separately.
Another common mistake is moving the selected order block backward to a different candle after the first one fails. That may create a new hypothesis, but it does not rescue the original one. Keep the first zone in the record and label any revised method with a new version.
Filling a fair value gap is not the same as proving a profitable trade. A chart can revisit the full interval and then continue in either direction. Claims that all gaps must fill need a specified instrument, timeframe, observation period and treatment of gaps that remain open. Without those details, the claim cannot be evaluated fairly.
Multiple indicators agreeing can also be less independent than it appears. If two tools use similar candles or the same displacement filter, their overlapping rectangles may reflect the same input rather than two separate pieces of evidence. Understand the rules before treating the overlap as stronger confirmation.
Test your understanding with two short exercises
Exercise 1: find the bullish gap
The first candle’s high is 100. The third candle’s low is 103. What interval does this lesson’s rule identify?
Reveal the explanation
The interval is 100–103, after the third candle closes. It is a relationship between the outer candles. The middle candle may have traded through that interval, so the pattern does not prove that no transactions occurred there.
Exercise 2: avoid a hindsight revision
You selected a bearish candle’s body as the order block. Price crosses it, then reacts at the candle’s lower wick. Can the original body-zone result be reported as a successful hold?
Reveal the explanation
No. The body-based rule and full-range rule are different. Record the body-zone failure according to its original definition. A wick-based version can be tested separately on fresh examples.
For a longer practice set, hide future candles and mark each eligible pattern as it becomes available. Record patterns that never receive a revisit. If your entry rule needs a close, do not use the final candle’s values before that close would have been known.
The TradingView explanation of look-ahead bias shows why information availability matters in testing. A historical label can look precise even when the required evidence was not available at the apparent entry time.
Compare the zones with a simpler baseline on the same sample, such as a previously defined high or low. Record the rules, number of observations, costs and ambiguous outcomes. A small practice exercise improves consistency; it cannot establish a dependable win rate or validate a trading system.
Why boundary choice changes the arithmetic
In the fictional gold example, the body zone spans $2 per ounce and the full candle spans $5 per ounce. Those widths do not themselves define a protective stop, but they show why switching definitions can materially change a proposed setup. If a separate rule places invalidation beyond the selected zone, a wider boundary can require a different position size for the same monetary loss budget.
Write down that change before comparing results. A body-entry method with one exit rule and a wick-entry method with another are two strategies, even if both screenshots use the same order-block label. Keep the order block vs fair value gap comparison focused on explicit, reproducible assumptions rather than on which rectangle looks best after the move.
Order block vs fair value gap questions
Which is better: an order block or a fair value gap?
There is no universal answer from the labels alone. A meaningful comparison needs explicit rules, a common test sample, realistic costs and a defined outcome. One method’s results cannot establish superiority for every market or timeframe.
Can an order block contain a fair value gap?
Depending on the definitions and selected candles, zones can overlap. Other examples, including this lesson’s body-based gold illustration, place them apart. Draw each boundary independently before discussing overlap.
Must every fair value gap be filled?
No such outcome is guaranteed. Define the observation horizon and what counts as a fill, then include unfilled cases in the record.
Does an order block show where banks placed orders?
An ordinary candle chart does not identify the owner of every underlying order. The label is an interpretation used by a method, not direct evidence of a particular institution’s inventory.
Can I use the same rules on gold and Bitcoin?
You can study the geometry on both, but feeds, volatility, products and costs differ. Test the complete rules separately rather than assuming that similar shapes produce equivalent outcomes.
For current market context, read the weekly gold outlook. For the next chart-reading skill, use the site’s price action patterns guide. Bring a chart with its timeframe and boundary rules when discussing an example in the community.