You open a gold chart at the same local time each day, yet the market suddenly seems to become active an hour earlier. Your strategy may not have changed. The clocks in London or New York may have changed instead.
Gold trading sessions are a useful way to organize observation, but three clocks need to stay separate: the regional session, your broker’s instrument schedule and your own local time. This guide explains that distinction, shows the seasonal conversions and gives you a practical way to compare sessions without assuming the busiest hour must be the most profitable.
Start with three clocks, not one opening time
A regional session describes a period associated with activity in a financial centre. It is a market convention, not a central exchange bell for every XAUUSD product. A broker’s trading schedule specifies when its particular symbol accepts orders. Your local clock tells you when to sit down for your planned observation.
For example, a chart indicator may shade a “New York session” while your broker has a holiday adjustment, a maintenance pause or a close-only restriction. The colored background does not override the broker’s schedule. A live price quote also does not necessarily mean that all order types are available.
Keep the product name alongside the time. An XAUUSD CFD, a gold futures contract and physical gold do not have interchangeable operating arrangements. A session guide for currency markets is useful context, but it is not a substitute for checking your gold instrument.
| Reference | Useful question | Does not establish |
|---|---|---|
| Regional session | Which market centre is in its usual working window? | Your broker’s exact opening or pause |
| Instrument schedule | Can this symbol trade on this date? | Whether an entry has an advantage |
| Local calendar | When can I observe and manage the plan? | A permanent UTC offset for another country |
Gold trading sessions: a practical UTC reference
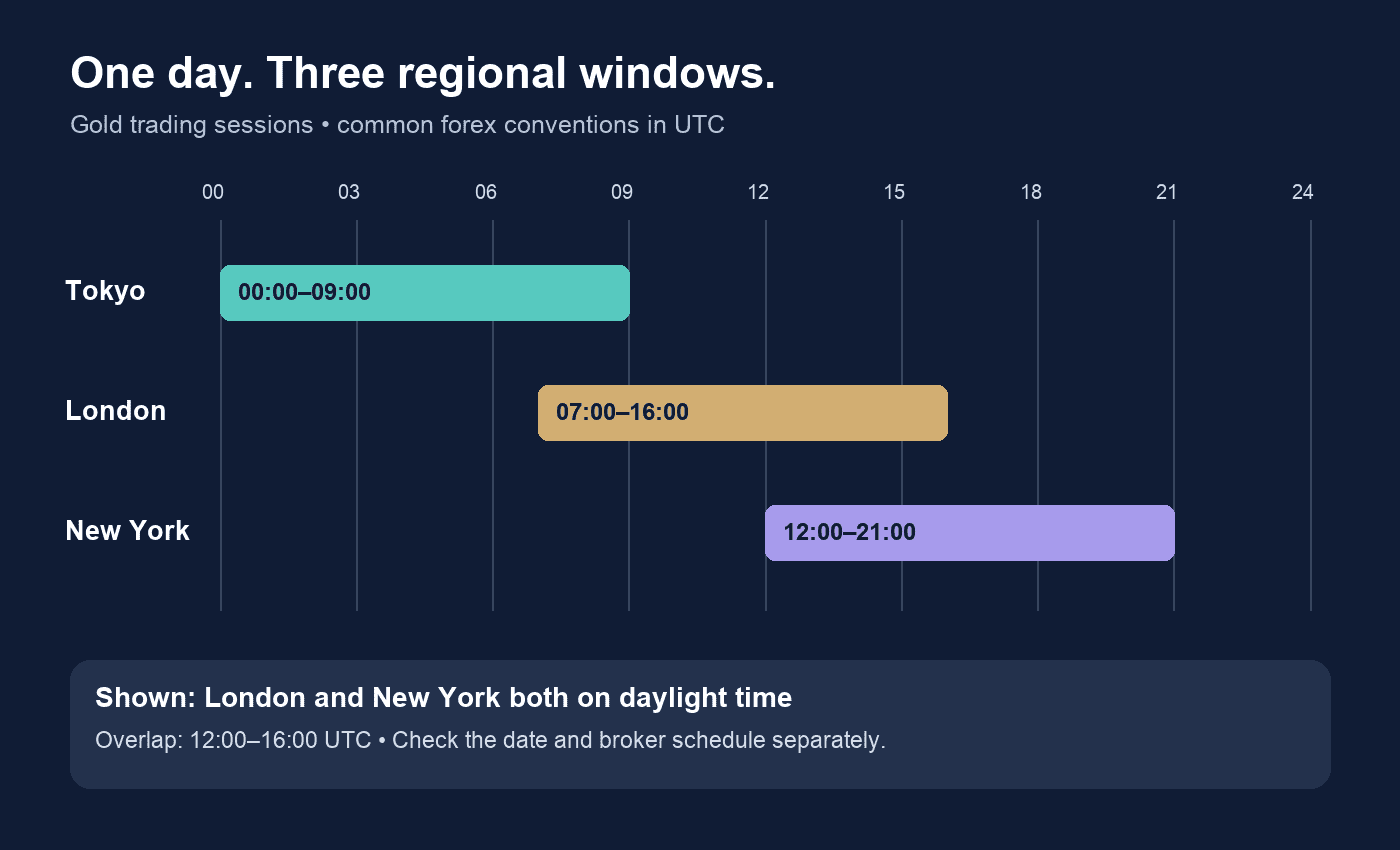
The table uses common forex-session conventions: Tokyo 09:00–18:00 Tokyo time, London 08:00–17:00 London time and New York 08:00–17:00 New York time. These are observation windows, not official gold exchange or broker hours. Session indicators sometimes use different boundaries; check their definitions before comparing results.
IG’s forex-session guide uses the London working-day convention. OANDA’s session introduction discusses regional sessions and overlap. Neither source establishes a guaranteed gold trading edge.
| Session convention | When that city observes standard time | When that city observes daylight time |
|---|---|---|
| Tokyo, 09:00–18:00 local | 00:00–09:00 | No seasonal change in this example |
| London, 08:00–17:00 local | 08:00–17:00 | 07:00–16:00 |
| New York, 08:00–17:00 local | 13:00–22:00 | 12:00–21:00 |
When London and New York are both on daylight time, their overlap under these conventions is 12:00–16:00 UTC. When both are on standard time, it is 13:00–17:00 UTC. During the weeks when the countries change clocks on different dates, calculate the windows separately rather than copying either row as a universal answer.
Why autumn can move the overlap
The UK government’s clock-change calendar lists 25 October as the end of British Summer Time in 2026. New York follows a different transition calendar. A dated timezone converter can therefore give a different London–New York relationship in late October from the one you used in September.
Use city-based zones such as Europe/London and America/New_York in calendars. “EST” means a specific standard-time offset; it is not a safe year-round label for New York civil time. Similarly, do not call every UK time GMT when the UK is observing BST.
Is the overlap the best time to trade gold?
It is a sensible window to investigate, but “best” needs a measurable definition. You might mean narrower transaction costs, more movement, fewer interruptions or simply a period when you can monitor a position properly. Those are different objectives.
A larger candle is not automatically a better opportunity. A move can travel farther while also producing worse entry slippage or exceeding the stop distance allowed by your plan. A quieter period can be unsuitable for one method and useful for studying a different kind of behavior.
Do not transfer statistics from a currency pair directly to gold. Even if a forex study finds a busy overlap for EURUSD, that does not measure the net result of your XAUUSD strategy. The instrument, broker feed, date range, costs and entry rules all need to match the claim being made.
News can matter more than the session label
Before selecting an observation window, check the economic calendar. The US Bureau of Labor Statistics schedules major releases including CPI and the Employment Situation at 08:30 Eastern on their announced dates. That corresponds to different UTC times in US daylight and standard time.
An event can alter price behavior inside an otherwise familiar session. Record whether your observation overlaps a major release. Mixing event days and ordinary days into one small sample can hide a difference that matters to execution.
Rollover and holidays need their own check
For an Exness account, use the official instrument schedule, choose the exact symbol, date and timezone, and inspect any restricted periods. Its current guidance notes that XAUUSD is usually closed during forex rollover. Do not assume a forex session rectangle means gold is continuously tradable.
Check the account notification area as well as the normal weekly schedule. Holiday arrangements can differ from an ordinary weekday. A saved screenshot from last month is useful for a historical journal, but it is not the authority for next week’s market opening.
Build a dated observation window
The tool below converts a UTC start and end into a selected city timezone using your browser’s timezone data. It does not fetch broker hours, holidays or economic events. Enter a window that you have already verified. For a window crossing UTC midnight, enter the following date in the end field.
Worked example: the same UTC window, different local calendars
For the illustrative 30 September 2026 window of 12:00–16:00 UTC, India reads 17:30–21:30. London reads 13:00–17:00 and New York reads 08:00–12:00 using the timezone rules for that date. These conversions do not make the period suitable for every trader.
If you are in a different city, choose the corresponding timezone in a trusted calendar. Do not add a fixed number from memory when the location observes seasonal clock changes. Save both the UTC reference and the local date so a review months later remains understandable.
Compare gold trading sessions with a journal
Start with one question: for example, how does the quoted spread on your exact gold symbol behave during two preselected observation windows? Keep the account type and measurement method consistent. Record the spread in price units as well as any platform points so the numbers remain interpretable.
Choose the observation dates before seeing the outcomes. Include ordinary days, event days and days when you decided not to participate. Write down the reason for each exclusion. Removing every awkward day after the fact makes a session look cleaner than it was.
- Before the window: save the instrument, feed, UTC interval, local interval and relevant event times.
- During the window: record quotes at the same planned intervals, plus interruptions or missing data.
- After the window: describe the price range and conditions without inventing hypothetical perfect entries.
- When comparing: separate chart observations from actual executed trade results.
If you later compare a complete strategy across sessions, keep its entry, exit and position-risk rules fixed. Include costs and missed executions. Changing the rules in the second session means you are comparing both a different time and a different strategy.
A small sample is a learning record, not proof of a durable advantage. If one week looks unusually good, check whether one large event dominates the result. Repeat the observation on fresh dates before making claims about a universally superior hour.
A small example of an honest session comparison
Imagine you observe two gold trading sessions on ten preselected weekdays. In window A, your recorded spread readings are usually between $0.20 and $0.35 per ounce. In window B, most are between $0.18 and $0.30, but one news release produces a brief $1.20 reading. These are invented numbers for explaining the log, not a measurement of any broker.
Reporting only the lowest reading would make window B look clearly superior. Reporting only the $1.20 outlier would make it look consistently expensive. Keep both the typical readings and the unusual event, and explain the sampling frequency. One quote every thirty minutes can miss brief widening that matters to an actual order.
At an illustrative one-ounce exposure, a $0.30 bid–ask difference represents $0.30 of spread distance. At ten ounces it represents $3. That arithmetic does not include commission, financing or any difference between the requested and executed price. It also does not tell you whether the trade idea itself was worthwhile.
Next, separate the ten dates into event and non-event observations without deleting either group. If only one event day exists, acknowledge that you have very little evidence about event conditions. Record gaps in the data instead of silently filling them with assumptions. A disconnected platform is a missing observation, not a zero spread.
This approach makes a comparison of gold trading sessions more useful than a blanket “London is best” label. It states what was measured, when it was measured and what remains unknown. Keep the raw notes so you can check the conclusion later. Your next sample should test the same question on new dates rather than select only days that support the first impression.
Fit the window to the person
A schedule that requires you to monitor gold while working, driving or sleeping is not a workable routine. Select a period you can observe consistently and decide in advance what happens when you cannot watch it. More screen time does not automatically improve decision quality.
The price action learning guide connects session context with chart structure and risk. Use the gold spread guide to understand the cost questions to record, then verify current figures in your own account. For the arithmetic after a complete trade plan exists, the gold profit and loss tool explains exposure.
Gold trading sessions: common questions
Can I trade XAUUSD 24 hours a day?
Check the broker’s schedule for the exact symbol. Daily breaks, weekends, holidays and maintenance can interrupt trading. A general statement about weekday forex availability does not establish continuous gold availability.
Is the Asian session always quiet?
No session label guarantees a particular range or direction. Regional events and global news can matter at any time. Compare a defined sample on your own feed rather than assuming every day repeats a stereotype.
What is the best time to trade gold in India?
Convert the observation window for the date and product you mean. For example, 12:00–16:00 UTC is 17:30–21:30 in India. This is a time conversion, not a recommendation about suitability, market access or a profitable strategy.
Why do two session indicators disagree?
They may use different local opening conventions, fixed UTC offsets or daylight-saving settings. Compare the inputs and documentation before comparing shaded chart regions.
Should I enter as soon as London opens?
A clock time alone is not an entry condition. A complete method must define price conditions, invalidation, exposure and execution. Observation can be the whole exercise.